
| Name: CADM2 | Sequence: fasta or formatted (437aa) | NCBI GI: 54607031 | |
|
Description: immunoglobulin superfamily, member 4D
|
Referenced in: Additional Genes in Development
| ||
|
Composition:
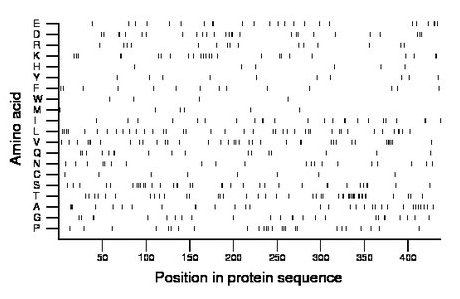
Amino acid Percentage Count Longest homopolymer A alanine 7.1 31 3 C cysteine 1.8 8 1 D aspartate 6.2 27 2 E glutamate 5.5 24 2 F phenylalanine 3.2 14 1 G glycine 5.7 25 2 H histidine 1.4 6 1 I isoleucine 5.5 24 2 K lysine 5.7 25 2 L leucine 9.2 40 2 M methionine 1.4 6 1 N asparagine 4.6 20 1 P proline 5.9 26 1 Q glutamine 3.9 17 2 R arginine 3.4 15 1 S serine 8.0 35 2 T threonine 9.8 43 3 V valine 8.5 37 3 W tryptophan 0.9 4 1 Y tyrosine 2.3 10 1 |
Comparative genomics:
Search single species RefSeq proteins at NCBI
Search summary 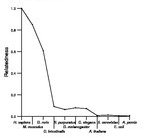
Figure data | ||
Related human proteins:Protein Relative score Description Self-match 1.000 immunoglobulin superfamily, member 4D CADM3 0.428 cell adhesion molecule 3 isoform 1 CADM3 0.426 cell adhesion molecule 3 isoform 2 CADM1 0.375 immunoglobulin superfamily, member 4D isoform 1 [Ho... CADM1 0.339 immunoglobulin superfamily, member 4D isoform 2 [Ho... CADM4 0.249 cell adhesion molecule 4 KIRREL 0.084 kin of IRRE like NTM 0.076 neurotrimin isoform 4 NTM 0.076 neurotrimin isoform 3 PVRL2 0.076 poliovirus receptor related 2 isoform delta precurs... NTM 0.076 neurotrimin isoform 1 CRTAM 0.074 class-I MHC-restricted T cell associated molecule [H... NTM 0.074 neurotrimin isoform 2 PVRL3 0.074 poliovirus receptor-related 3 PXDN 0.073 peroxidasin OPCML 0.073 opioid binding protein/cell adhesion molecule-like is... LSAMP 0.073 limbic system-associated membrane protein OPCML 0.072 opioid binding protein/cell adhesion molecule-like i... VCAM1 0.071 vascular cell adhesion molecule 1 isoform a precursor... VCAM1 0.069 vascular cell adhesion molecule 1 isoform b precurso... IGLON5 0.069 IgLON family member 5 TTN 0.067 titin isoform N2-A NEO1 0.067 neogenin homolog 1 PVRL2 0.067 poliovirus receptor related 2 isoform alpha precursor... NCAM2 0.065 neural cell adhesion molecule 2 precursor LOC100292387 0.065 PREDICTED: similar to hemicentin 2 HMCN2 0.065 PREDICTED: hemicentin 2 HMCN1 0.065 hemicentin 1 PXDNL 0.063 peroxidasin homolog-like KIRREL2 0.063 kin of IRRE-like 2 isoform cHuman BLASTP results (used to prepare the table) | |||
Gene descriptions are from NCBI RefSeq. Search results were obtained with NCBI BLAST and RefSeq entries. When identical proteins are present, the self-match may not be listed first in BLASTP output. In such cases, the table above has been reordered to place it first.
See About the Figures for the scoring system used in the figure above right. The same scoring system was used in the table of BLASTP results.
Guide to the Human Genome
Copyright © 2010 by Stewart Scherer. All rights reserved.
