
| Name: CRTAM | Sequence: fasta or formatted (393aa) | NCBI GI: 51593098 | |
|
Description: class-I MHC-restricted T cell associated molecule
| Not currently referenced in the text | ||
|
Composition:
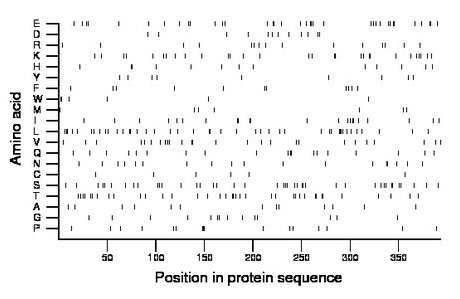
Amino acid Percentage Count Longest homopolymer A alanine 3.3 13 1 C cysteine 1.5 6 1 D aspartate 3.1 12 1 E glutamate 9.2 36 2 F phenylalanine 2.8 11 1 G glycine 3.6 14 2 H histidine 3.3 13 2 I isoleucine 5.6 22 2 K lysine 7.4 29 2 L leucine 10.9 43 3 M methionine 1.8 7 1 N asparagine 4.6 18 2 P proline 4.1 16 3 Q glutamine 4.8 19 2 R arginine 3.8 15 1 S serine 10.4 41 2 T threonine 9.4 37 2 V valine 6.6 26 2 W tryptophan 1.5 6 2 Y tyrosine 2.3 9 1 |
Comparative genomics:
Search single species RefSeq proteins at NCBI
Search summary 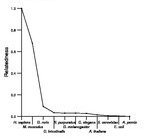
Figure data | ||
Related human proteins:Protein Relative score Description Self-match 1.000 class-I MHC-restricted T cell associated molecule [H... CADM3 0.092 cell adhesion molecule 3 isoform 2 CADM3 0.092 cell adhesion molecule 3 isoform 1 CADM1 0.091 immunoglobulin superfamily, member 4D isoform 2 [Ho... CADM1 0.091 immunoglobulin superfamily, member 4D isoform 1 [Ho... CADM2 0.083 immunoglobulin superfamily, member 4D CADM4 0.055 cell adhesion molecule 4 LSAMP 0.043 limbic system-associated membrane protein KIRREL 0.040 kin of IRRE like NTM 0.038 neurotrimin isoform 4 NTM 0.038 neurotrimin isoform 3 NTM 0.038 neurotrimin isoform 2 NTM 0.038 neurotrimin isoform 1 OPCML 0.034 opioid binding protein/cell adhesion molecule-like i... OPCML 0.034 opioid binding protein/cell adhesion molecule-like is... PXDN 0.032 peroxidasin KIRREL3 0.032 kin of IRRE like 3 isoform 2 KIRREL3 0.032 kin of IRRE like 3 isoform 1 PDGFRA 0.029 platelet-derived growth factor receptor alpha precurs... F11R 0.028 F11 receptor precursor SIRPB1 0.028 signal-regulatory protein beta 1 isoform 1 precurso... MUSK 0.028 skeletal muscle receptor tyrosine kinase IGSF10 0.028 immunoglobulin superfamily, member 10 SIRPB1 0.026 signal-regulatory protein beta 1 isoform 3 precurso... SIRPA 0.026 signal-regulatory protein alpha precursor SIRPA 0.026 signal-regulatory protein alpha precursor SIRPA 0.026 signal-regulatory protein alpha precursor IGLON5 0.026 IgLON family member 5 GPR116 0.026 G-protein coupled receptor 116 GPR116 0.026 G-protein coupled receptor 116Human BLASTP results (used to prepare the table) | |||
Gene descriptions are from NCBI RefSeq. Search results were obtained with NCBI BLAST and RefSeq entries. When identical proteins are present, the self-match may not be listed first in BLASTP output. In such cases, the table above has been reordered to place it first.
See About the Figures for the scoring system used in the figure above right. The same scoring system was used in the table of BLASTP results.
Guide to the Human Genome
Copyright © 2010 by Stewart Scherer. All rights reserved.
