
| Name: PEAR1 | Sequence: fasta or formatted (1037aa) | NCBI GI: 122937343 | |
|
Description: platelet endothelial aggregation receptor 1
|
Referenced in:
| ||
|
Composition:
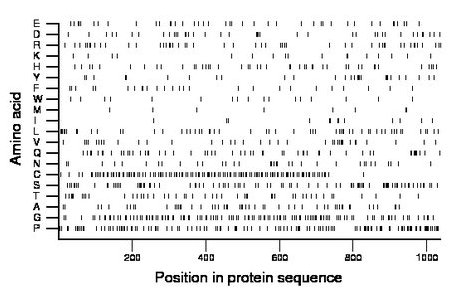
Amino acid Percentage Count Longest homopolymer A alanine 4.9 51 1 C cysteine 12.0 124 2 D aspartate 3.9 40 2 E glutamate 4.1 42 3 F phenylalanine 2.5 26 2 G glycine 11.5 119 2 H histidine 4.5 47 3 I isoleucine 1.3 13 1 K lysine 1.6 17 1 L leucine 5.5 57 4 M methionine 0.9 9 1 N asparagine 3.4 35 2 P proline 12.5 130 4 Q glutamine 5.2 54 1 R arginine 5.0 52 3 S serine 8.6 89 2 T threonine 4.7 49 4 V valine 3.7 38 2 W tryptophan 1.6 17 1 Y tyrosine 2.7 28 2 |
Comparative genomics:
Search single species RefSeq proteins at NCBI
Search summary 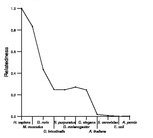
Figure data | ||
Related human proteins:Protein Relative score Description Self-match 1.000 platelet endothelial aggregation receptor 1 MEGF10 0.409 multiple EGF-like-domains 10 MEGF11 0.368 multiple EGF-like-domains 11 MEGF6 0.249 EGF-like-domain, multiple 3 SCARF1 0.107 scavenger receptor class F, member 1 isoform 3 precu... SCARF1 0.107 scavenger receptor class F, member 1 isoform 1 precu... SCARF2 0.099 scavenger receptor class F, member 2 isoform 1 [Homo... SCARF2 0.099 scavenger receptor class F, member 2 isoform 2 [Homo... TNXB 0.097 tenascin XB isoform 1 precursor NOTCH3 0.095 Notch homolog 3 NOTCH4 0.093 notch4 preproprotein NOTCH1 0.089 notch1 preproprotein NOTCH2 0.080 notch 2 preproprotein TNC 0.080 tenascin C precursor JAG1 0.079 jagged 1 precursor JAG2 0.078 jagged 2 isoform a precursor JAG2 0.078 jagged 2 isoform b precursor LAMA5 0.075 laminin alpha 5 SCARF1 0.070 scavenger receptor class F, member 1 isoform 5 prec... SNED1 0.069 6720455I24Rik homolog LAMB4 0.059 laminin, beta 4 LAMA2 0.058 laminin alpha 2 subunit isoform b precursor LAMA2 0.058 laminin alpha 2 subunit isoform a precursor LAMB2 0.058 laminin, beta 2 precursor LAMA1 0.055 laminin, alpha 1 precursor DLL4 0.052 delta-like 4 protein precursor LAMC3 0.051 laminin, gamma 3 precursor LAMB1 0.050 laminin, beta 1 precursor EYS 0.050 eyes shut homolog isoform 1 USH2A 0.049 usherin isoform BHuman BLASTP results (used to prepare the table) | |||
Gene descriptions are from NCBI RefSeq. Search results were obtained with NCBI BLAST and RefSeq entries. When identical proteins are present, the self-match may not be listed first in BLASTP output. In such cases, the table above has been reordered to place it first.
See About the Figures for the scoring system used in the figure above right. The same scoring system was used in the table of BLASTP results.
Guide to the Human Genome
Copyright © 2010 by Stewart Scherer. All rights reserved.
