
| Name: NOTCH3 | Sequence: fasta or formatted (2321aa) | NCBI GI: 134244285 | |
|
Description: Notch homolog 3
|
Referenced in:
| ||
|
Composition:
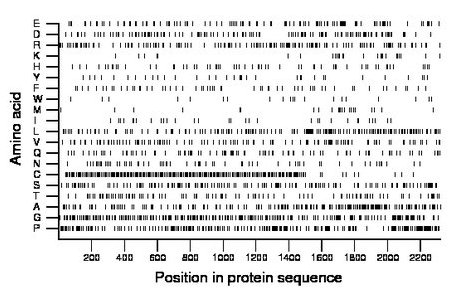
Amino acid Percentage Count Longest homopolymer A alanine 8.5 198 3 C cysteine 10.0 231 1 D aspartate 6.0 140 2 E glutamate 5.0 115 2 F phenylalanine 2.5 59 2 G glycine 11.4 264 3 H histidine 2.6 61 2 I isoleucine 1.4 33 2 K lysine 1.2 28 2 L leucine 7.9 184 5 M methionine 1.0 23 1 N asparagine 2.9 67 2 P proline 10.6 247 7 Q glutamine 4.0 94 2 R arginine 6.3 147 6 S serine 6.8 158 2 T threonine 4.4 103 3 V valine 5.0 115 2 W tryptophan 0.9 20 1 Y tyrosine 1.5 34 1 |
Comparative genomics:
Search single species RefSeq proteins at NCBI
Search summary 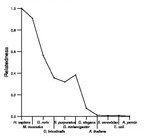
Figure data | ||
Related human proteins:Protein Relative score Description Self-match 1.000 Notch homolog 3 NOTCH1 0.485 notch1 preproprotein NOTCH2 0.481 notch 2 preproprotein NOTCH4 0.226 notch4 preproprotein EYS 0.099 eyes shut homolog isoform 1 JAG1 0.097 jagged 1 precursor JAG2 0.089 jagged 2 isoform a precursor MEGF6 0.086 EGF-like-domain, multiple 3 FBN2 0.086 fibrillin 2 precursor JAG2 0.084 jagged 2 isoform b precursor FBN3 0.083 fibrillin 3 precursor FBN1 0.083 fibrillin 1 precursor SNED1 0.082 6720455I24Rik homolog CRB1 0.064 crumbs homolog 1 precursor CRB2 0.061 crumbs homolog 2 LTBP4 0.055 latent transforming growth factor beta binding prot... LTBP4 0.055 latent transforming growth factor beta binding prot... LTBP4 0.055 latent transforming growth factor beta binding prot... MEGF10 0.050 multiple EGF-like-domains 10 MEGF11 0.050 multiple EGF-like-domains 11 DNER 0.048 delta-notch-like EGF repeat-containing transmembran... DLL1 0.048 delta-like 1 TNXB 0.047 tenascin XB isoform 1 precursor SVEP1 0.047 polydom LTBP2 0.045 latent transforming growth factor beta binding protei... PEAR1 0.042 platelet endothelial aggregation receptor 1 DLL4 0.042 delta-like 4 protein precursor LTBP1 0.040 latent transforming growth factor beta binding prote... LTBP1 0.040 latent transforming growth factor beta binding prote... LTBP3 0.038 latent transforming growth factor beta binding prot...Human BLASTP results (used to prepare the table) | |||
Gene descriptions are from NCBI RefSeq. Search results were obtained with NCBI BLAST and RefSeq entries. When identical proteins are present, the self-match may not be listed first in BLASTP output. In such cases, the table above has been reordered to place it first.
See About the Figures for the scoring system used in the figure above right. The same scoring system was used in the table of BLASTP results.
Guide to the Human Genome
Copyright © 2010 by Stewart Scherer. All rights reserved.
