
| Name: CLPX | Sequence: fasta or formatted (633aa) | NCBI GI: 7242140 | |
|
Description: ClpX caseinolytic protease X homolog
|
Referenced in: Mitochondria
| ||
|
Composition:
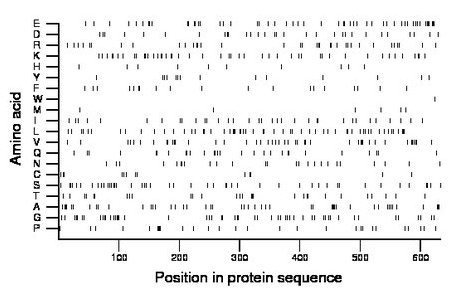
Amino acid Percentage Count Longest homopolymer A alanine 7.7 49 5 C cysteine 2.1 13 1 D aspartate 4.7 30 2 E glutamate 8.2 52 3 F phenylalanine 3.0 19 2 G glycine 8.4 53 2 H histidine 1.7 11 2 I isoleucine 5.5 35 2 K lysine 7.4 47 2 L leucine 9.3 59 3 M methionine 1.1 7 1 N asparagine 3.9 25 2 P proline 4.6 29 5 Q glutamine 4.9 31 3 R arginine 5.7 36 3 S serine 7.6 48 2 T threonine 4.6 29 2 V valine 7.1 45 3 W tryptophan 0.2 1 1 Y tyrosine 2.2 14 1 |
Comparative genomics:
Search single species RefSeq proteins at NCBI
Search summary 
Figure data | ||
Related human proteins:Protein Relative score Description Self-match 1.000 ClpX caseinolytic protease X homolog PSMC5 0.020 proteasome 26S ATPase subunit 5 PSMC6 0.016 proteasome 26S ATPase subunit 6 PSMC3 0.016 proteasome 26S ATPase subunit 3 YME1L1 0.016 YME1-like 1 isoform 1 YME1L1 0.016 YME1-like 1 isoform 3 PSMC1 0.015 proteasome 26S ATPase subunit 1 NSF 0.014 vesicle-fusing ATPase SPAST 0.014 spastin isoform 2 SPAST 0.014 spastin isoform 1 ATAD1 0.014 ATPase family, AAA domain containing 1 PSMC2 0.014 proteasome 26S ATPase subunit 2 PEX6 0.014 peroxisomal biogenesis factor 6 KATNA1 0.014 katanin p60 subunit A 1 LOC728806 0.013 PREDICTED: similar to N-ethylmaleimide-sensitive fa... SPATA5L1 0.012 spermatogenesis associated 5-like 1 SPG7 0.012 spastic paraplegia 7 isoform 2 FIGNL1 0.012 fidgetin-like 1 FIGNL1 0.012 fidgetin-like 1 KATNAL1 0.012 katanin p60 subunit A-like 1 KATNAL1 0.012 katanin p60 subunit A-like 1 NVL 0.011 nuclear VCP-like isoform 2 NVL 0.011 nuclear VCP-like isoform 1 AFG3L2 0.011 AFG3 ATPase family gene 3-like 2 KATNAL2 0.011 katanin p60 subunit A-like 2 VCP 0.011 valosin-containing protein LONP1 0.010 mitochondrial lon peptidase 1 SPG7 0.010 spastic paraplegia 7 isoform 1 ATAD2 0.010 ATPase family, AAA domain containing 2 PEX1 0.010 peroxin1Human BLASTP results (used to prepare the table) | |||
Gene descriptions are from NCBI RefSeq. Search results were obtained with NCBI BLAST and RefSeq entries. When identical proteins are present, the self-match may not be listed first in BLASTP output. In such cases, the table above has been reordered to place it first.
See About the Figures for the scoring system used in the figure above right. The same scoring system was used in the table of BLASTP results.
Guide to the Human Genome
Copyright © 2010 by Stewart Scherer. All rights reserved.
