
| Name: LONP1 | Sequence: fasta or formatted (959aa) | NCBI GI: 21396489 | |
|
Description: mitochondrial lon peptidase 1
|
Referenced in:
| ||
|
Composition:
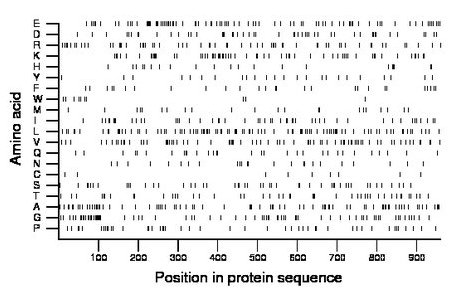
Amino acid Percentage Count Longest homopolymer A alanine 8.8 84 3 C cysteine 0.9 9 1 D aspartate 5.1 49 2 E glutamate 9.3 89 2 F phenylalanine 2.8 27 1 G glycine 7.8 75 3 H histidine 2.2 21 1 I isoleucine 5.2 50 2 K lysine 6.7 64 2 L leucine 10.2 98 2 M methionine 2.5 24 2 N asparagine 2.5 24 1 P proline 5.0 48 2 Q glutamine 3.4 33 2 R arginine 6.4 61 2 S serine 4.9 47 2 T threonine 4.7 45 1 V valine 8.0 77 2 W tryptophan 1.0 10 1 Y tyrosine 2.5 24 1 |
Comparative genomics:
Search single species RefSeq proteins at NCBI
Search summary 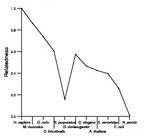
Figure data | ||
Related human proteins:Protein Relative score Description Self-match 1.000 mitochondrial lon peptidase 1 LONP2 0.233 peroxisomal LON protease-like LOC652826 0.013 PREDICTED: similar to proteasome 26S ATPase subunit ... PSMC6 0.013 proteasome 26S ATPase subunit 6 PSMC4 0.012 proteasome 26S ATPase subunit 4 isoform 1 SPG7 0.012 spastic paraplegia 7 isoform 1 PSMC4 0.012 proteasome 26S ATPase subunit 4 isoform 2 KIF3C 0.012 kinesin family member 3C VCP 0.011 valosin-containing protein GOLGB1 0.011 golgi autoantigen, golgin subfamily b, macrogolgin ... DCTN1 0.010 dynactin 1 isoform 4 DCTN1 0.010 dynactin 1 isoform 3 DCTN1 0.010 dynactin 1 isoform 2 DCTN1 0.010 dynactin 1 isoform 1 KRT9 0.010 keratin 9 CLIP1 0.010 restin isoform b CLIP1 0.010 restin isoform a SPAST 0.010 spastin isoform 2 SPAST 0.010 spastin isoform 1 AFG3L2 0.010 AFG3 ATPase family gene 3-like 2 PSMC5 0.009 proteasome 26S ATPase subunit 5 LRCH2 0.009 leucine-rich repeats and calponin homology (CH) dom... CLPB 0.009 caseinolytic peptidase B SPATA5 0.009 spermatogenesis associated 5 SPATA5L1 0.009 spermatogenesis associated 5-like 1 VPS4B 0.009 vacuolar protein sorting factor 4B YME1L1 0.009 YME1-like 1 isoform 1 YME1L1 0.009 YME1-like 1 isoform 3 TRIP13 0.009 thyroid hormone receptor interactor 13 PEX6 0.009 peroxisomal biogenesis factor 6Human BLASTP results (used to prepare the table) | |||
Gene descriptions are from NCBI RefSeq. Search results were obtained with NCBI BLAST and RefSeq entries. When identical proteins are present, the self-match may not be listed first in BLASTP output. In such cases, the table above has been reordered to place it first.
See About the Figures for the scoring system used in the figure above right. The same scoring system was used in the table of BLASTP results.
Guide to the Human Genome
Copyright © 2010 by Stewart Scherer. All rights reserved.
