
| Name: FAT2 | Sequence: fasta or formatted (4349aa) | NCBI GI: 13787217 | |
|
Description: FAT tumor suppressor 2 precursor
|
Referenced in: Cadherins and Related Proteins
| ||
|
Composition:
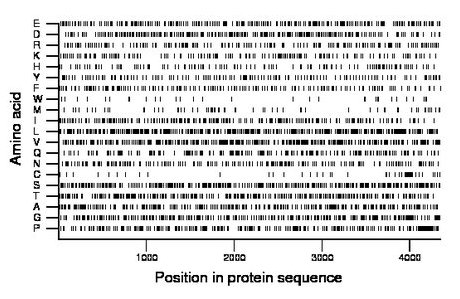
Amino acid Percentage Count Longest homopolymer A alanine 6.2 269 2 C cysteine 1.2 54 2 D aspartate 6.4 277 3 E glutamate 6.2 268 3 F phenylalanine 3.8 167 2 G glycine 6.6 285 4 H histidine 2.9 124 2 I isoleucine 5.0 218 3 K lysine 3.6 158 2 L leucine 8.9 389 3 M methionine 1.6 70 1 N asparagine 4.5 196 3 P proline 6.4 278 2 Q glutamine 4.3 187 2 R arginine 4.3 188 3 S serine 8.3 361 4 T threonine 6.8 296 3 V valine 8.9 385 3 W tryptophan 0.7 32 1 Y tyrosine 3.4 147 2 |
Comparative genomics:
Search single species RefSeq proteins at NCBI
Search summary 
Figure data | ||
Related human proteins:Protein Relative score Description Self-match 1.000 FAT tumor suppressor 2 precursor FAT1 0.404 FAT tumor suppressor 1 precursor FAT3 0.376 FAT tumor suppressor homolog 3 FAT4 0.123 FAT tumor suppressor homolog 4 CDH23 0.097 cadherin-like 23 isoform 1 precursor DCHS1 0.089 dachsous 1 precursor DCHS2 0.073 dachsous 2 isoform 1 CELSR2 0.044 cadherin EGF LAG seven-pass G-type receptor 2 DCHS2 0.042 dachsous 2 isoform 2 CELSR3 0.041 cadherin EGF LAG seven-pass G-type receptor 3 [Homo... CELSR1 0.039 cadherin EGF LAG seven-pass G-type receptor 1 PCDH15 0.028 protocadherin 15 isoform CD1-8 precursor PCDH15 0.028 protocadherin 15 isoform CD1-4 precursor PCDH15 0.028 protocadherin 15 isoform CD1-10 precursor PCDH15 0.028 protocadherin 15 isoform CD3-2 precursor PCDH15 0.028 protocadherin 15 isoform CD3-1 precursor PCDH15 0.028 protocadherin 15 isoform CD2-2 precursor PCDH15 0.028 protocadherin 15 isoform CD1-9 precursor PCDH15 0.028 protocadherin 15 isoform CD1-7 precursor PCDH15 0.028 protocadherin 15 isoform CD1-2 precursor PCDH15 0.028 protocadherin 15 isoform CD1-1 precursor PCDH15 0.028 protocadherin 15 isoform CD2-1 precursor PCDH15 0.026 protocadherin 15 isoform CD1-6 precursor PCDH9 0.026 protocadherin 9 isoform 2 precursor PCDH9 0.026 protocadherin 9 isoform 1 precursor PCDH11Y 0.026 protocadherin 11 Y-linked isoform c PCDH11Y 0.026 protocadherin 11 Y-linked isoform b PCDH11Y 0.026 protocadherin 11 Y-linked isoform a PCDH11X 0.026 protocadherin 11 X-linked isoform a precursor PCDH11X 0.026 protocadherin 11 X-linked isoform dHuman BLASTP results (used to prepare the table) | |||
Gene descriptions are from NCBI RefSeq. Search results were obtained with NCBI BLAST and RefSeq entries. When identical proteins are present, the self-match may not be listed first in BLASTP output. In such cases, the table above has been reordered to place it first.
See About the Figures for the scoring system used in the figure above right. The same scoring system was used in the table of BLASTP results.
Guide to the Human Genome
Copyright © 2010 by Stewart Scherer. All rights reserved.
