
| Name: CARTPT | Sequence: fasta or formatted (116aa) | NCBI GI: 4757910 | |
|
Description: cocaine- and amphetamine-regulated transcript
|
Referenced in: Adipose Tissue
| ||
|
Composition:
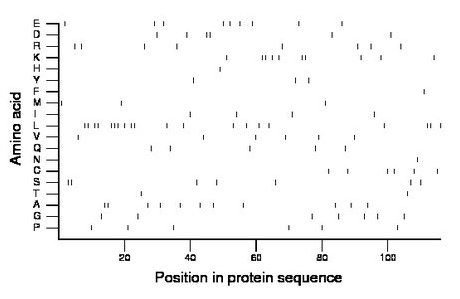
Amino acid Percentage Count Longest homopolymer A alanine 9.5 11 2 C cysteine 5.2 6 1 D aspartate 5.2 6 2 E glutamate 7.8 9 1 F phenylalanine 0.9 1 1 G glycine 6.0 7 1 H histidine 0.9 1 1 I isoleucine 3.4 4 1 K lysine 8.6 10 2 L leucine 17.2 20 3 M methionine 2.6 3 1 N asparagine 0.9 1 1 P proline 5.2 6 1 Q glutamine 4.3 5 1 R arginine 6.9 8 1 S serine 6.0 7 2 T threonine 1.7 2 1 V valine 5.2 6 1 W tryptophan 0.0 0 0 Y tyrosine 2.6 3 1 |
Comparative genomics:
Search single species RefSeq proteins at NCBI
Search summary 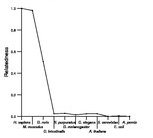
Figure data | ||
Related human proteins:Protein Relative score Description Self-match 1.000 cocaine- and amphetamine-regulated transcript CTF1 0.034 cardiotrophin 1 isoform 2 CTF1 0.034 cardiotrophin 1 isoform 1 ZNF572 0.019 zinc finger protein 572 SERPINF1 0.014 serine (or cysteine) proteinase inhibitor, clade F (... CP110 0.014 CP110 protein LOC653061 0.014 PREDICTED: similar to Golgin subfamily A member 8-l... LOC653061 0.014 PREDICTED: similar to Golgin subfamily A member 8-l... LOC653061 0.014 PREDICTED: similar to Golgin subfamily A member 8-l... LOC653061 0.014 PREDICTED: similar to Golgin subfamily A member 8-l... FBN3 0.010 fibrillin 3 precursor HAUS8 0.010 sarcoma antigen NY-SAR-48 isoform b HAUS8 0.010 sarcoma antigen NY-SAR-48 isoform a GOLGA8E 0.010 golgi autoantigen, golgin subfamily a, 8E APOB 0.010 apolipoprotein B precursor GOLGA8F 0.010 golgi autoantigen, golgin subfamily a, 8F NOTCH4 0.010 notch4 preproprotein CCDC155 0.010 coiled-coil domain containing 155 GOLGA8G 0.010 golgi autoantigen, golgin subfamily a, 8G DKK2 0.005 dickkopf homolog 2 precursor LOC390561 0.005 PREDICTED: similar to hect domain and RLD 2 LOC390561 0.005 PREDICTED: similar to hect domain and RLD 2 LOC390561 0.005 PREDICTED: similar to hect domain and RLD 2 PTCD1 0.005 pentatricopeptide repeat domain 1 GPAT2 0.005 glycerol-3-phosphate acyltransferase 2, mitochondri... NOTCH1 0.005 notch1 preproprotein CD9 0.005 CD9 antigen GOLGA4 0.005 golgi autoantigen, golgin subfamily a, 4 IQSEC2 0.005 IQ motif and Sec7 domain 2 isoform 2 IQSEC2 0.005 IQ motif and Sec7 domain 2 isoform1Human BLASTP results (used to prepare the table) | |||
Gene descriptions are from NCBI RefSeq. Search results were obtained with NCBI BLAST and RefSeq entries. When identical proteins are present, the self-match may not be listed first in BLASTP output. In such cases, the table above has been reordered to place it first.
See About the Figures for the scoring system used in the figure above right. The same scoring system was used in the table of BLASTP results.
Guide to the Human Genome
Copyright © 2010 by Stewart Scherer. All rights reserved.
