
| Name: EIF4ENIF1 | Sequence: fasta or formatted (985aa) | NCBI GI: 9789865 | |
|
Description: eukaryotic translation initiation factor 4E nuclear import factor 1
|
Referenced in:
| ||
|
Composition:
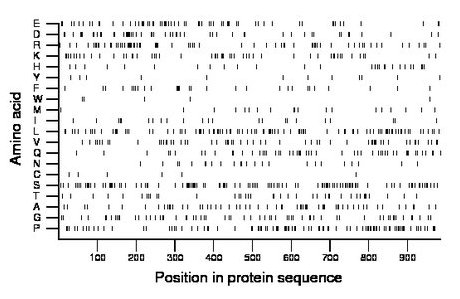
Amino acid Percentage Count Longest homopolymer A alanine 6.4 63 3 C cysteine 0.6 6 1 D aspartate 5.5 54 2 E glutamate 6.9 68 3 F phenylalanine 2.9 29 2 G glycine 6.5 64 3 H histidine 2.7 27 1 I isoleucine 2.3 23 2 K lysine 5.5 54 2 L leucine 10.2 100 2 M methionine 2.0 20 1 N asparagine 2.4 24 2 P proline 9.3 92 2 Q glutamine 5.6 55 3 R arginine 7.3 72 3 S serine 11.9 117 4 T threonine 4.3 42 2 V valine 5.9 58 2 W tryptophan 0.5 5 1 Y tyrosine 1.2 12 1 |
Comparative genomics:
Search single species RefSeq proteins at NCBI
Search summary 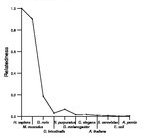
Figure data | ||
Related human proteins:Protein Relative score Description Self-match 1.000 eukaryotic translation initiation factor 4E nuclear i... TNRC18 0.012 trinucleotide repeat containing 18 GLTSCR1 0.010 glioma tumor suppressor candidate region gene 1 [Ho... APC2 0.010 adenomatosis polyposis coli 2 ANKRD17 0.010 ankyrin repeat domain protein 17 isoform a ANKRD17 0.010 ankyrin repeat domain protein 17 isoform b FLJ22184 0.010 PREDICTED: hypothetical protein FLJ22184 FLJ22184 0.010 PREDICTED: hypothetical protein FLJ22184 LOC100128719 0.010 PREDICTED: hypothetical protein, partial LOC100128719 0.010 PREDICTED: hypothetical protein, partial LOC100134147 0.009 PREDICTED: hypothetical protein LEF1 0.009 lymphoid enhancer-binding factor 1 isoform 3 LEF1 0.009 lymphoid enhancer-binding factor 1 isoform 2 NHSL1 0.009 NHS-like 1 LEF1 0.009 lymphoid enhancer-binding factor 1 isoform 1 LOC100134663 0.009 PREDICTED: hypothetical protein, partial AMOT 0.009 angiomotin isoform 1 PRG4 0.009 proteoglycan 4 isoform D PRG4 0.009 proteoglycan 4 isoform C PRG4 0.009 proteoglycan 4 isoform B PRG4 0.009 proteoglycan 4 isoform A GNAS 0.009 GNAS complex locus alex SRRM2 0.009 splicing coactivator subunit SRm300 WNK2 0.008 WNK lysine deficient protein kinase 2 LOC284297 0.008 hypothetical protein LOC284297 MED25 0.008 mediator complex subunit 25 MUC6 0.008 mucin 6, gastric PHC3 0.007 polyhomeotic like 3 KIAA0182 0.007 genetic suppressor element 1 isoform 1 SRRM1 0.007 serine/arginine repetitive matrix 1Human BLASTP results (used to prepare the table) | |||
Gene descriptions are from NCBI RefSeq. Search results were obtained with NCBI BLAST and RefSeq entries. When identical proteins are present, the self-match may not be listed first in BLASTP output. In such cases, the table above has been reordered to place it first.
See About the Figures for the scoring system used in the figure above right. The same scoring system was used in the table of BLASTP results.
Guide to the Human Genome
Copyright © 2010 by Stewart Scherer. All rights reserved.
