
| Name: NHSL1 | Sequence: fasta or formatted (1606aa) | NCBI GI: 221139926 | |
|
Description: NHS-like 1
|
Referenced in: Additional Genes in Development
| ||
|
Composition:
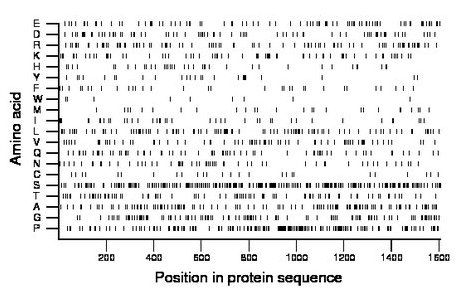
Amino acid Percentage Count Longest homopolymer A alanine 7.5 120 2 C cysteine 1.6 26 1 D aspartate 4.8 77 3 E glutamate 5.8 93 3 F phenylalanine 2.0 32 1 G glycine 7.4 119 4 H histidine 2.3 37 1 I isoleucine 2.6 41 2 K lysine 4.6 74 3 L leucine 6.5 104 3 M methionine 1.7 27 1 N asparagine 3.5 56 2 P proline 11.6 186 5 Q glutamine 4.3 69 2 R arginine 6.0 96 2 S serine 15.8 253 4 T threonine 5.4 87 2 V valine 4.6 74 2 W tryptophan 0.6 9 1 Y tyrosine 1.6 26 2 |
Comparative genomics:
Search single species RefSeq proteins at NCBI
Search summary 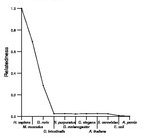
Figure data | ||
Related human proteins:Protein Relative score Description Self-match 1.000 NHS-like 1 NHS 0.122 Nance-Horan syndrome protein isoform 1 NHS 0.121 Nance-Horan syndrome protein isoform 2 KIAA1522 0.029 hypothetical protein LOC57648 NACA 0.024 nascent polypeptide-associated complex alpha subuni... C6orf132 0.022 PREDICTED: chromosome 6 open reading frame 132 [Hom... C6orf132 0.022 PREDICTED: chromosome 6 open reading frame 132 [Hom... C6orf132 0.022 PREDICTED: hypothetical protein LOC647024 FLJ22184 0.021 PREDICTED: hypothetical protein FLJ22184 MUC2 0.021 mucin 2 precursor FLJ22184 0.021 PREDICTED: hypothetical protein LOC80164 RAPH1 0.020 Ras association and pleckstrin homology domains 1 is... PRR12 0.020 proline rich 12 MLL2 0.019 myeloid/lymphoid or mixed-lineage leukemia 2 PRG4 0.019 proteoglycan 4 isoform D PRG4 0.019 proteoglycan 4 isoform C PRG4 0.019 proteoglycan 4 isoform B PRG4 0.019 proteoglycan 4 isoform A WASF2 0.018 WAS protein family, member 2 MUC17 0.018 mucin 17 SRRM2 0.018 splicing coactivator subunit SRm300 MLL4 0.018 myeloid/lymphoid or mixed-lineage leukemia 4 WIPF3 0.018 WAS/WASL interacting protein family, member 3 [Homo... CPSF6 0.017 cleavage and polyadenylation specific factor 6, 68 ... FLJ22184 0.017 PREDICTED: hypothetical protein FLJ22184 SFRS15 0.017 splicing factor, arginine/serine-rich 15 isoform 3 ... YLPM1 0.017 YLP motif containing 1 GLTSCR1 0.017 glioma tumor suppressor candidate region gene 1 [Ho... RERE 0.017 atrophin-1 like protein isoform b RERE 0.017 atrophin-1 like protein isoform aHuman BLASTP results (used to prepare the table) | |||
Gene descriptions are from NCBI RefSeq. Search results were obtained with NCBI BLAST and RefSeq entries. When identical proteins are present, the self-match may not be listed first in BLASTP output. In such cases, the table above has been reordered to place it first.
See About the Figures for the scoring system used in the figure above right. The same scoring system was used in the table of BLASTP results.
Guide to the Human Genome
Copyright © 2010 by Stewart Scherer. All rights reserved.
