
| Name: PHC3 | Sequence: fasta or formatted (995aa) | NCBI GI: 148612879 | |
|
Description: polyhomeotic like 3
|
Referenced in: Stem Cells and Early Development
| ||
|
Composition:
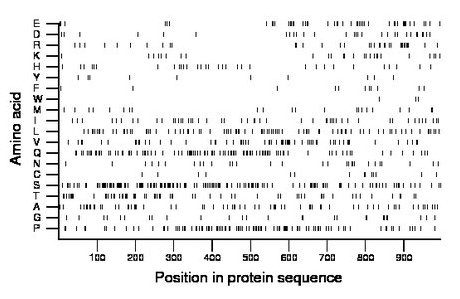
Amino acid Percentage Count Longest homopolymer A alanine 7.1 71 2 C cysteine 1.4 14 1 D aspartate 2.9 29 2 E glutamate 5.1 51 3 F phenylalanine 1.1 11 1 G glycine 2.7 27 1 H histidine 3.3 33 2 I isoleucine 5.1 51 3 K lysine 2.7 27 2 L leucine 8.9 89 4 M methionine 2.3 23 1 N asparagine 2.9 29 2 P proline 10.9 108 4 Q glutamine 10.7 106 6 R arginine 3.7 37 2 S serine 15.0 149 7 T threonine 6.6 66 5 V valine 6.1 61 3 W tryptophan 0.3 3 1 Y tyrosine 1.0 10 1 |
Comparative genomics:
Search single species RefSeq proteins at NCBI
Search summary 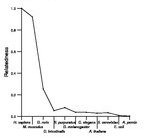
Figure data | ||
Related human proteins:Protein Relative score Description Self-match 1.000 polyhomeotic like 3 PHC1 0.140 polyhomeotic 1-like PHC2 0.135 polyhomeotic-like 2 isoform a PHC2 0.114 polyhomeotic-like 2 isoform b FLJ22184 0.037 PREDICTED: hypothetical protein FLJ22184 CIZ1 0.030 CDKN1A interacting zinc finger protein 1 isoform 1 ... CIZ1 0.030 CDKN1A interacting zinc finger protein 1 isoform 1 [... TSC22D1 0.030 TSC22 domain family, member 1 isoform 1 RERE 0.029 atrophin-1 like protein isoform b RERE 0.029 atrophin-1 like protein isoform a RERE 0.029 atrophin-1 like protein isoform a WNK2 0.028 WNK lysine deficient protein kinase 2 MUC6 0.027 mucin 6, gastric SAP130 0.026 Sin3A-associated protein, 130kDa isoform a SAP130 0.025 Sin3A-associated protein, 130kDa isoform b FLJ22184 0.025 PREDICTED: hypothetical protein FLJ22184 SAMD7 0.025 sterile alpha motif domain containing 7 BRD4 0.025 bromodomain-containing protein 4 isoform long MUC17 0.024 mucin 17 SCMH1 0.024 sex comb on midleg 1 isoform 2 BPTF 0.023 bromodomain PHD finger transcription factor isoform ... EP400 0.023 E1A binding protein p400 SCML2 0.023 sex comb on midleg-like 2 SCMH1 0.023 sex comb on midleg 1 isoform 1 SAMD11 0.022 sterile alpha motif domain containing 11 RAPH1 0.022 Ras association and pleckstrin homology domains 1 is... FLJ22184 0.021 PREDICTED: hypothetical protein LOC80164 L3MBTL3 0.021 l(3)mbt-like 3 isoform b L3MBTL3 0.021 l(3)mbt-like 3 isoform a MLL2 0.021 myeloid/lymphoid or mixed-lineage leukemia 2Human BLASTP results (used to prepare the table) | |||
Gene descriptions are from NCBI RefSeq. Search results were obtained with NCBI BLAST and RefSeq entries. When identical proteins are present, the self-match may not be listed first in BLASTP output. In such cases, the table above has been reordered to place it first.
See About the Figures for the scoring system used in the figure above right. The same scoring system was used in the table of BLASTP results.
Guide to the Human Genome
Copyright © 2010 by Stewart Scherer. All rights reserved.
