
| Name: GLTSCR1 | Sequence: fasta or formatted (1560aa) | NCBI GI: 163914392 | |
|
Description: glioma tumor suppressor candidate region gene 1
| Not currently referenced in the text | ||
|
Composition:
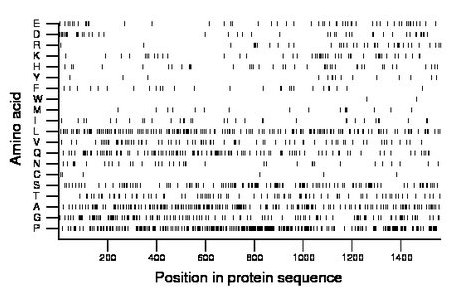
Amino acid Percentage Count Longest homopolymer A alanine 12.8 199 4 C cysteine 0.4 6 1 D aspartate 3.1 48 2 E glutamate 3.5 55 2 F phenylalanine 1.7 27 1 G glycine 8.5 133 6 H histidine 2.6 40 1 I isoleucine 2.2 35 2 K lysine 2.9 46 2 L leucine 10.6 165 4 M methionine 1.1 17 1 N asparagine 2.4 37 1 P proline 17.9 279 7 Q glutamine 7.1 110 2 R arginine 2.6 40 2 S serine 9.1 142 8 T threonine 5.7 89 3 V valine 4.8 75 2 W tryptophan 0.1 2 1 Y tyrosine 1.0 15 1 |
Comparative genomics:
Search single species RefSeq proteins at NCBI
Search summary 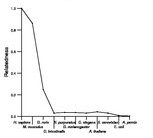
Figure data | ||
Related human proteins:Protein Relative score Description Self-match 1.000 glioma tumor suppressor candidate region gene 1 [Ho... NACA 0.055 nascent polypeptide-associated complex alpha subuni... FLJ22184 0.044 PREDICTED: hypothetical protein FLJ22184 KIAA0240 0.042 hypothetical protein LOC23506 FLJ22184 0.038 PREDICTED: hypothetical protein LOC80164 FLJ22184 0.037 PREDICTED: hypothetical protein FLJ22184 SRCAP 0.035 Snf2-related CBP activator protein FMN2 0.034 formin 2 MUC2 0.033 mucin 2 precursor PRG4 0.033 proteoglycan 4 isoform D PRG4 0.033 proteoglycan 4 isoform C PRG4 0.033 proteoglycan 4 isoform B PRG4 0.033 proteoglycan 4 isoform A RAPH1 0.032 Ras association and pleckstrin homology domains 1 is... CIC 0.032 capicua homolog WNK2 0.031 WNK lysine deficient protein kinase 2 MLL2 0.029 myeloid/lymphoid or mixed-lineage leukemia 2 PCLO 0.029 piccolo isoform 2 PCLO 0.029 piccolo isoform 1 RERE 0.027 atrophin-1 like protein isoform b RERE 0.027 atrophin-1 like protein isoform a RERE 0.027 atrophin-1 like protein isoform a PPRC1 0.026 peroxisome proliferator-activated receptor gamma, co... LOC284297 0.026 hypothetical protein LOC284297 BCORL1 0.025 BCL6 co-repressor-like 1 ATN1 0.025 atrophin-1 ATN1 0.025 atrophin-1 KIAA0754 0.024 hypothetical protein LOC643314 PRB2 0.024 proline-rich protein BstNI subfamily 2 PRB1 0.024 proline-rich protein BstNI subfamily 1 isoform 1 pre...Human BLASTP results (used to prepare the table) | |||
Gene descriptions are from NCBI RefSeq. Search results were obtained with NCBI BLAST and RefSeq entries. When identical proteins are present, the self-match may not be listed first in BLASTP output. In such cases, the table above has been reordered to place it first.
See About the Figures for the scoring system used in the figure above right. The same scoring system was used in the table of BLASTP results.
Guide to the Human Genome
Copyright © 2010 by Stewart Scherer. All rights reserved.
