
| Name: LPIN3 | Sequence: fasta or formatted (851aa) | NCBI GI: 74271888 | |
|
Description: lipin 3
|
Referenced in: Adipose Tissue
| ||
|
Composition:
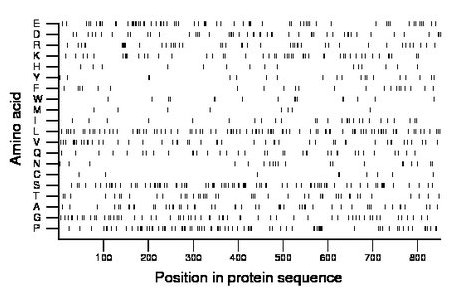
Amino acid Percentage Count Longest homopolymer A alanine 6.0 51 2 C cysteine 1.1 9 1 D aspartate 6.1 52 3 E glutamate 7.6 65 2 F phenylalanine 2.7 23 2 G glycine 7.8 66 2 H histidine 1.8 15 1 I isoleucine 3.2 27 1 K lysine 5.6 48 2 L leucine 10.5 89 2 M methionine 1.1 9 1 N asparagine 2.4 20 1 P proline 9.3 79 2 Q glutamine 4.3 37 2 R arginine 5.5 47 5 S serine 9.9 84 2 T threonine 5.2 44 2 V valine 5.9 50 2 W tryptophan 1.9 16 2 Y tyrosine 2.4 20 1 |
Comparative genomics:
Search single species RefSeq proteins at NCBI
Search summary 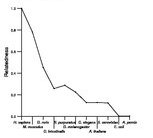
Figure data | ||
Related human proteins:Protein Relative score Description Self-match 1.000 lipin 3 LPIN2 0.456 lipin 2 LPIN1 0.423 lipin 1 HCN4 0.015 hyperpolarization activated cyclic nucleotide-gated p... MAP1S 0.014 BPY2 interacting protein 1 NACA 0.013 nascent polypeptide-associated complex alpha subuni... HDGF2 0.012 hepatoma-derived growth factor-related protein 2 iso... HDGF2 0.012 hepatoma-derived growth factor-related protein 2 iso... DCAF5 0.011 WD repeat domain 22 LOC100133756 0.011 PREDICTED: hypothetical protein, partial DNAJC6 0.010 DnaJ (Hsp40) homolog, subfamily C, member 6 LOC284297 0.010 hypothetical protein LOC284297 ZNF469 0.010 zinc finger protein 469 RP1L1 0.010 retinitis pigmentosa 1-like 1 PRG4 0.009 proteoglycan 4 isoform D PRG4 0.009 proteoglycan 4 isoform C PRG4 0.009 proteoglycan 4 isoform B PRG4 0.009 proteoglycan 4 isoform A ANKRD11 0.009 ankyrin repeat domain 11 CCDC88B 0.009 coiled-coil domain containing 88 MAPT 0.009 microtubule-associated protein tau isoform 5 ITPKC 0.009 inositol 1,4,5-trisphosphate 3-kinase C C2orf71 0.009 hypothetical protein LOC388939 TACC2 0.008 transforming, acidic coiled-coil containing protein... TROAP 0.008 tastin isoform 1 IRF7 0.008 interferon regulatory factor 7 isoform d IRF7 0.008 interferon regulatory factor 7 isoform a C2orf55 0.008 hypothetical protein LOC343990 ITPKB 0.008 1D-myo-inositol-trisphosphate 3-kinase B BNIPL 0.008 BCL2/adenovirus E1B 19kD interacting protein like i...Human BLASTP results (used to prepare the table) | |||
Gene descriptions are from NCBI RefSeq. Search results were obtained with NCBI BLAST and RefSeq entries. When identical proteins are present, the self-match may not be listed first in BLASTP output. In such cases, the table above has been reordered to place it first.
See About the Figures for the scoring system used in the figure above right. The same scoring system was used in the table of BLASTP results.
Guide to the Human Genome
Copyright © 2010 by Stewart Scherer. All rights reserved.
