
| Name: MAP1S | Sequence: fasta or formatted (1059aa) | NCBI GI: 50428935 | |
|
Description: BPY2 interacting protein 1
|
Referenced in: Testes and Sperm
| ||
|
Composition:
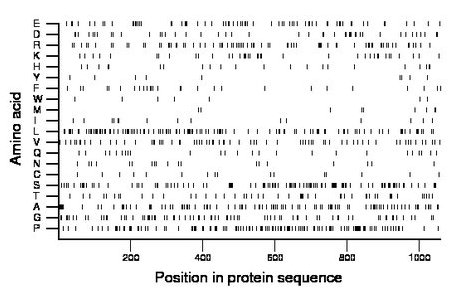
Amino acid Percentage Count Longest homopolymer A alanine 10.2 108 4 C cysteine 1.6 17 2 D aspartate 4.3 46 2 E glutamate 6.7 71 2 F phenylalanine 2.6 28 2 G glycine 7.6 81 3 H histidine 2.2 23 2 I isoleucine 1.4 15 1 K lysine 3.7 39 2 L leucine 11.8 125 3 M methionine 0.9 10 1 N asparagine 1.8 19 1 P proline 11.9 126 3 Q glutamine 2.5 26 1 R arginine 7.2 76 2 S serine 10.4 110 2 T threonine 4.9 52 2 V valine 6.7 71 2 W tryptophan 0.7 7 1 Y tyrosine 0.8 9 1 |
Comparative genomics:
Search single species RefSeq proteins at NCBI
Search summary 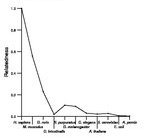
Figure data | ||
Related human proteins:Protein Relative score Description Self-match 1.000 BPY2 interacting protein 1 MAP1B 0.201 microtubule-associated protein 1B MAP1A 0.128 microtubule-associated protein 1A NACA 0.032 nascent polypeptide-associated complex alpha subuni... PRG4 0.031 proteoglycan 4 isoform D PRG4 0.031 proteoglycan 4 isoform C PRG4 0.031 proteoglycan 4 isoform B PRG4 0.031 proteoglycan 4 isoform A FLJ22184 0.030 PREDICTED: hypothetical protein FLJ22184 FLJ22184 0.028 PREDICTED: hypothetical protein LOC80164 FLJ22184 0.027 PREDICTED: hypothetical protein FLJ22184 MLL2 0.024 myeloid/lymphoid or mixed-lineage leukemia 2 LOC100294236 0.022 PREDICTED: similar to diffuse panbronchiolitis crit... SRCAP 0.022 Snf2-related CBP activator protein MICALL1 0.021 molecule interacting with Rab13 PCLO 0.021 piccolo isoform 2 PCLO 0.021 piccolo isoform 1 GLTSCR1 0.021 glioma tumor suppressor candidate region gene 1 [Ho... MAST4 0.020 microtubule associated serine/threonine kinase fami... NEFH 0.020 neurofilament, heavy polypeptide 200kDa KIAA0754 0.020 hypothetical protein LOC643314 RERE 0.020 atrophin-1 like protein isoform b RERE 0.020 atrophin-1 like protein isoform a RERE 0.020 atrophin-1 like protein isoform a SRRM1 0.019 serine/arginine repetitive matrix 1 DPCR1 0.019 diffuse panbronchiolitis critical region 1 protein ... NPIPL3 0.019 nuclear pore complex interacting protein-like 3 [Ho... MUC4 0.019 mucin 4 isoform a MLL4 0.019 myeloid/lymphoid or mixed-lineage leukemia 4 MUC17 0.019 mucin 17Human BLASTP results (used to prepare the table) | |||
Gene descriptions are from NCBI RefSeq. Search results were obtained with NCBI BLAST and RefSeq entries. When identical proteins are present, the self-match may not be listed first in BLASTP output. In such cases, the table above has been reordered to place it first.
See About the Figures for the scoring system used in the figure above right. The same scoring system was used in the table of BLASTP results.
Guide to the Human Genome
Copyright © 2010 by Stewart Scherer. All rights reserved.
