
| Name: LPIN2 | Sequence: fasta or formatted (896aa) | NCBI GI: 7662022 | |
|
Description: lipin 2
|
Referenced in: Adipose Tissue
| ||
|
Composition:
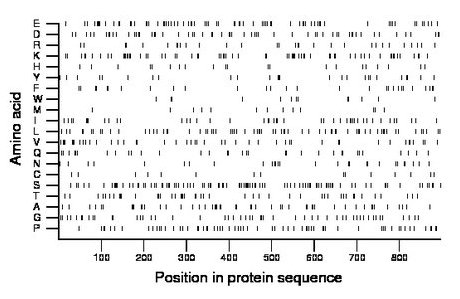
Amino acid Percentage Count Longest homopolymer A alanine 6.4 57 3 C cysteine 1.7 15 1 D aspartate 6.7 60 3 E glutamate 8.4 75 3 F phenylalanine 3.1 28 2 G glycine 5.8 52 2 H histidine 2.5 22 2 I isoleucine 5.0 45 3 K lysine 7.7 69 4 L leucine 7.9 71 2 M methionine 1.6 14 1 N asparagine 3.1 28 1 P proline 7.0 63 2 Q glutamine 3.8 34 3 R arginine 3.5 31 3 S serine 11.2 100 3 T threonine 5.2 47 2 V valine 5.0 45 2 W tryptophan 1.6 14 2 Y tyrosine 2.9 26 2 |
Comparative genomics:
Search single species RefSeq proteins at NCBI
Search summary 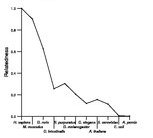
Figure data | ||
Related human proteins:Protein Relative score Description Self-match 1.000 lipin 2 LPIN1 0.469 lipin 1 LPIN3 0.434 lipin 3 TRDN 0.014 triadin AP3B1 0.009 adaptor-related protein complex 3, beta 1 subunit [H... SYTL2 0.008 synaptotagmin-like 2 isoform i SYTL2 0.008 synaptotagmin-like 2 isoform g IWS1 0.008 IWS1 homolog DCAF6 0.008 IQ motif and WD repeats 1 isoform a PMS2 0.008 PMS2 postmeiotic segregation increased 2 isoform a [H... TCOF1 0.008 Treacher Collins-Franceschetti syndrome 1 isoform f... TCOF1 0.008 Treacher Collins-Franceschetti syndrome 1 isoform b ... MAST2 0.007 microtubule associated serine/threonine kinase 2 [H... RBMX2 0.007 RNA binding motif protein, X-linked 2 NOLC1 0.007 nucleolar and coiled-body phosphoprotein 1 RP1L1 0.007 retinitis pigmentosa 1-like 1 DCAF6 0.007 IQ motif and WD repeats 1 isoform b AKAP12 0.007 A kinase (PRKA) anchor protein 12 isoform 1 AKAP12 0.007 A kinase (PRKA) anchor protein 12 isoform 2 E2F7 0.007 E2F transcription factor 7 C8orf47 0.007 hypothetical protein LOC203111 TTK 0.006 TTK protein kinase LOXHD1 0.006 lipoxygenase homology domains 1 isoform 1 TCOF1 0.006 Treacher Collins-Franceschetti syndrome 1 isoform e... TCOF1 0.006 Treacher Collins-Franceschetti syndrome 1 isoform d... TCOF1 0.006 Treacher Collins-Franceschetti syndrome 1 isoform a ... TCOF1 0.006 Treacher Collins-Franceschetti syndrome 1 isoform c ... SETD1B 0.006 SET domain containing 1B TTF1 0.006 transcription termination factor, RNA polymerase I [... NKAP 0.006 NFKB activating proteinHuman BLASTP results (used to prepare the table) | |||
Gene descriptions are from NCBI RefSeq. Search results were obtained with NCBI BLAST and RefSeq entries. When identical proteins are present, the self-match may not be listed first in BLASTP output. In such cases, the table above has been reordered to place it first.
See About the Figures for the scoring system used in the figure above right. The same scoring system was used in the table of BLASTP results.
Guide to the Human Genome
Copyright © 2010 by Stewart Scherer. All rights reserved.
