
| Name: S100B | Sequence: fasta or formatted (92aa) | NCBI GI: 5454034 | |
|
Description: S100 calcium-binding protein, beta
|
Referenced in:
| ||
|
Composition:
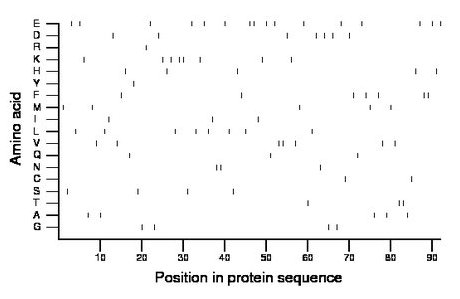
Amino acid Percentage Count Longest homopolymer A alanine 5.4 5 1 C cysteine 2.2 2 1 D aspartate 7.6 7 1 E glutamate 17.4 16 2 F phenylalanine 7.6 7 2 G glycine 4.3 4 1 H histidine 5.4 5 1 I isoleucine 3.3 3 1 K lysine 8.7 8 2 L leucine 8.7 8 1 M methionine 5.4 5 1 N asparagine 3.3 3 2 P proline 0.0 0 0 Q glutamine 3.3 3 1 R arginine 1.1 1 1 S serine 4.3 4 1 T threonine 3.3 3 2 V valine 7.6 7 2 W tryptophan 0.0 0 0 Y tyrosine 1.1 1 1 |
Comparative genomics:
Search single species RefSeq proteins at NCBI
Search summary 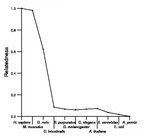
Figure data | ||
Related human proteins:Protein Relative score Description Self-match 1.000 S100 calcium-binding protein, beta S100A1 0.518 S100 calcium binding protein A1 S100P 0.445 S100 calcium binding protein P S100A4 0.415 S100 calcium-binding protein A4 S100A4 0.415 S100 calcium-binding protein A4 S100A2 0.402 S100 calcium binding protein A2 S100Z 0.384 S100 calcium binding protein Z S100A5 0.323 S100 calcium binding protein A5 S100A12 0.317 S100 calcium-binding protein A12 S100A11 0.299 S100 calcium binding protein A11 S100A9 0.287 S100 calcium-binding protein A9 FLG2 0.280 filaggrin family member 2 S100A6 0.280 S100 calcium-binding protein A6 S100A3 0.262 S100 calcium binding protein A3 S100A10 0.262 S100 calcium binding protein A10 RPTN 0.256 repetin HRNR 0.232 hornerin TCHH 0.220 trichohyalin S100A16 0.213 S100 calcium binding protein A16 FLG 0.195 filaggrin S100A8 0.195 S100 calcium-binding protein A8 CRNN 0.177 cornulin S100G 0.165 calbindin 3 S100A13 0.146 S100 calcium binding protein A13 S100A13 0.146 S100 calcium binding protein A13 S100A13 0.146 S100 calcium binding protein A13 S100A13 0.146 S100 calcium binding protein A13 S100A13 0.146 S100 calcium binding protein A13 S100A7A 0.140 S100 calcium binding protein A7-like 1 LOC731414 0.134 PREDICTED: similar to S100 calcium binding protein ...Human BLASTP results (used to prepare the table) | |||
Gene descriptions are from NCBI RefSeq. Search results were obtained with NCBI BLAST and RefSeq entries. When identical proteins are present, the self-match may not be listed first in BLASTP output. In such cases, the table above has been reordered to place it first.
See About the Figures for the scoring system used in the figure above right. The same scoring system was used in the table of BLASTP results.
Guide to the Human Genome
Copyright © 2010 by Stewart Scherer. All rights reserved.
