
| Name: S100A16 | Sequence: fasta or formatted (103aa) | NCBI GI: 17933772 | |
|
Description: S100 calcium binding protein A16
|
Referenced in:
| ||
|
Composition:
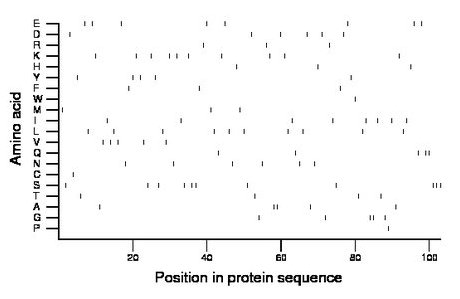
Amino acid Percentage Count Longest homopolymer A alanine 4.9 5 2 C cysteine 1.0 1 1 D aspartate 5.8 6 1 E glutamate 7.8 8 1 F phenylalanine 2.9 3 1 G glycine 4.9 5 2 H histidine 2.9 3 1 I isoleucine 7.8 8 1 K lysine 9.7 10 1 L leucine 9.7 10 1 M methionine 2.9 3 1 N asparagine 5.8 6 1 P proline 1.0 1 1 Q glutamine 4.9 5 2 R arginine 2.9 3 1 S serine 10.7 11 3 T threonine 3.9 4 1 V valine 4.9 5 1 W tryptophan 1.0 1 1 Y tyrosine 4.9 5 1 |
Comparative genomics:
Search single species RefSeq proteins at NCBI
Search summary 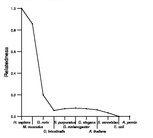
Figure data | ||
Related human proteins:Protein Relative score Description Self-match 1.000 S100 calcium binding protein A16 S100B 0.192 S100 calcium-binding protein, beta S100A13 0.192 S100 calcium binding protein A13 S100A13 0.192 S100 calcium binding protein A13 S100A13 0.192 S100 calcium binding protein A13 S100A13 0.192 S100 calcium binding protein A13 S100A13 0.192 S100 calcium binding protein A13 S100A4 0.170 S100 calcium-binding protein A4 S100A4 0.170 S100 calcium-binding protein A4 S100Z 0.170 S100 calcium binding protein Z S100A1 0.165 S100 calcium binding protein A1 FLG2 0.154 filaggrin family member 2 S100A2 0.143 S100 calcium binding protein A2 S100P 0.143 S100 calcium binding protein P S100A9 0.132 S100 calcium-binding protein A9 HRNR 0.126 hornerin S100A10 0.121 S100 calcium binding protein A10 S100A11 0.121 S100 calcium binding protein A11 S100A6 0.104 S100 calcium-binding protein A6 S100A12 0.104 S100 calcium-binding protein A12 S100A8 0.104 S100 calcium-binding protein A8 S100A14 0.099 S100 calcium binding protein A14 PPP3R1 0.093 protein phosphatase 3, regulatory subunit B, alpha is... S100A7 0.093 S100 calcium binding protein A7 FLG 0.093 filaggrin S100A5 0.093 S100 calcium binding protein A5 S100A7A 0.088 S100 calcium binding protein A7-like 1 S100G 0.066 calbindin 3 TCHH 0.060 trichohyalin S100A3 0.060 S100 calcium binding protein A3Human BLASTP results (used to prepare the table) | |||
Gene descriptions are from NCBI RefSeq. Search results were obtained with NCBI BLAST and RefSeq entries. When identical proteins are present, the self-match may not be listed first in BLASTP output. In such cases, the table above has been reordered to place it first.
See About the Figures for the scoring system used in the figure above right. The same scoring system was used in the table of BLASTP results.
Guide to the Human Genome
Copyright © 2010 by Stewart Scherer. All rights reserved.
