
| Name: ASAM | Sequence: fasta or formatted (373aa) | NCBI GI: 13376115 | |
|
Description: adipocyte-specific adhesion molecule
|
Referenced in: Adipose Tissue
| ||
|
Composition:
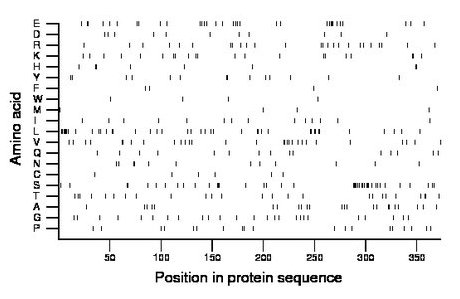
Amino acid Percentage Count Longest homopolymer A alanine 6.2 23 2 C cysteine 1.6 6 1 D aspartate 2.9 11 1 E glutamate 8.8 33 4 F phenylalanine 1.1 4 1 G glycine 6.7 25 1 H histidine 2.1 8 2 I isoleucine 3.8 14 1 K lysine 5.6 21 2 L leucine 10.7 40 7 M methionine 1.1 4 1 N asparagine 3.2 12 2 P proline 5.1 19 2 Q glutamine 4.0 15 1 R arginine 6.7 25 2 S serine 11.0 41 5 T threonine 6.7 25 2 V valine 7.8 29 2 W tryptophan 1.1 4 1 Y tyrosine 3.8 14 2 |
Comparative genomics:
Search single species RefSeq proteins at NCBI
Search summary 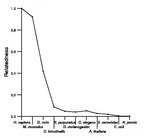
Figure data | ||
Related human proteins:Protein Relative score Description Self-match 1.000 adipocyte-specific adhesion molecule CXADR 0.209 coxsackie virus and adenovirus receptor precursor [Ho... IGSF11 0.139 immunoglobulin superfamily, member 11 isoform b [Hom... IGSF11 0.139 immunoglobulin superfamily, member 11 isoform a [Hom... GPA33 0.125 transmembrane glycoprotein A33 precursor VSIG2 0.120 V-set and immunoglobulin domain containing 2 ESAM 0.115 endothelial cell adhesion molecule VSIG1 0.113 V-set and immunoglobulin domain containing 1 VSIG8 0.109 V-set and immunoglobulin domain containing 8 JAM3 0.063 junctional adhesion molecule 3 precursor F11R 0.056 F11 receptor precursor LSAMP 0.053 limbic system-associated membrane protein PXDN 0.049 peroxidasin CD2 0.046 CD2 molecule NTM 0.045 neurotrimin isoform 4 NTM 0.045 neurotrimin isoform 3 HMCN2 0.045 PREDICTED: hemicentin 2 HMCN2 0.045 PREDICTED: hemicentin 2 NTM 0.045 neurotrimin isoform 2 NTM 0.045 neurotrimin isoform 1 LRIG1 0.045 leucine-rich repeats and immunoglobulin-like domains... TTN 0.045 titin isoform N2-A JAM2 0.042 junctional adhesion molecule 2 precursor HMCN2 0.042 PREDICTED: hemicentin 2 OPCML 0.042 opioid binding protein/cell adhesion molecule-like i... OPCML 0.042 opioid binding protein/cell adhesion molecule-like is... CD22 0.041 CD22 molecule LOC100292387 0.041 PREDICTED: similar to hemicentin 2 LOC100289200 0.041 PREDICTED: hypothetical protein XP_002342997 FCRL3 0.041 Fc receptor-like 3 precursorHuman BLASTP results (used to prepare the table) | |||
Gene descriptions are from NCBI RefSeq. Search results were obtained with NCBI BLAST and RefSeq entries. When identical proteins are present, the self-match may not be listed first in BLASTP output. In such cases, the table above has been reordered to place it first.
See About the Figures for the scoring system used in the figure above right. The same scoring system was used in the table of BLASTP results.
Guide to the Human Genome
Copyright © 2010 by Stewart Scherer. All rights reserved.
