
| Name: CETN3 | Sequence: fasta or formatted (167aa) | NCBI GI: 46397403 | |
|
Description: centrin 3
|
Referenced in:
| ||
|
Composition:
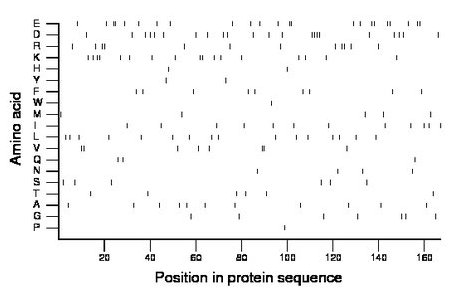
Amino acid Percentage Count Longest homopolymer A alanine 6.6 11 1 C cysteine 0.0 0 0 D aspartate 13.2 22 4 E glutamate 13.8 23 2 F phenylalanine 5.4 9 1 G glycine 4.2 7 1 H histidine 1.2 2 1 I isoleucine 7.2 12 1 K lysine 10.2 17 2 L leucine 9.6 16 1 M methionine 3.0 5 1 N asparagine 2.4 4 1 P proline 0.6 1 1 Q glutamine 1.8 3 1 R arginine 7.2 12 2 S serine 3.6 6 1 T threonine 3.6 6 1 V valine 4.8 8 2 W tryptophan 0.6 1 1 Y tyrosine 1.2 2 1 |
Comparative genomics:
Search single species RefSeq proteins at NCBI
Search summary 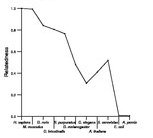
Figure data | ||
Related human proteins:Protein Relative score Description Self-match 1.000 centrin 3 CETN1 0.528 centrin 1 CETN2 0.521 caltractin CALM3 0.307 calmodulin 3 CALM2 0.307 calmodulin 2 CALM1 0.307 calmodulin 1 CALML3 0.300 calmodulin-like 3 CALML5 0.228 calmodulin-like 5 CABP4 0.221 calcium binding protein 4 TNNC2 0.218 fast skeletal muscle troponin C CALML6 0.205 calmodulin-like 6 CABP2 0.195 calcium binding protein 2 isoform 2 CABP5 0.191 calcium binding protein 5 CABP2 0.191 calcium binding protein 2 isoform 1 CABP1 0.188 calcium binding protein 1 isoform 2 CABP1 0.188 calcium binding protein 1 isoform 1 CABP1 0.182 calcium binding protein 1 isoform 3 MYL6B 0.175 smooth muscle and non-muscle myosin alkali light chai... TNNC1 0.175 troponin C, slow CALML4 0.168 calmodulin-like 4 isoform 1 MYL1 0.162 fast skeletal myosin alkali light chain 1 isoform 1f... EFCAB2 0.158 EF-hand calcium binding domain 2 isoform a MYL2 0.155 slow cardiac myosin regulatory light chain 2 MYL6 0.152 myosin, light chain 6, alkali, smooth muscle and non... MYL6 0.149 myosin, light chain 6, alkali, smooth muscle and non... MYL9 0.145 myosin regulatory light chain 9 isoform a MYL1 0.145 fast skeletal myosin alkali light chain 1 isoform 3f... MYL12A 0.142 myosin, light chain 12A, regulatory, non-sarcomeric [... MYL5 0.139 myosin regulatory light chain 5 MYL12B 0.132 myosin regulatory light chain MRCL2 isoform A [Homo...Human BLASTP results (used to prepare the table) | |||
Gene descriptions are from NCBI RefSeq. Search results were obtained with NCBI BLAST and RefSeq entries. When identical proteins are present, the self-match may not be listed first in BLASTP output. In such cases, the table above has been reordered to place it first.
See About the Figures for the scoring system used in the figure above right. The same scoring system was used in the table of BLASTP results.
Guide to the Human Genome
Copyright © 2010 by Stewart Scherer. All rights reserved.
