
| Name: CETN2 | Sequence: fasta or formatted (172aa) | NCBI GI: 4757902 | |
|
Description: caltractin
|
Referenced in:
| ||
|
Composition:
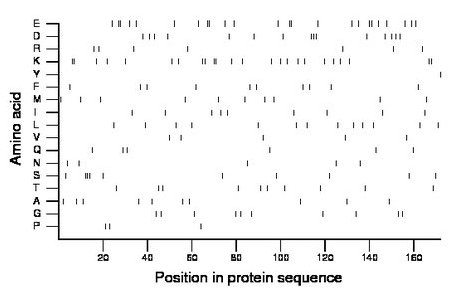
Amino acid Percentage Count Longest homopolymer A alanine 5.8 10 1 C cysteine 0.0 0 0 D aspartate 8.7 15 3 E glutamate 14.0 24 2 F phenylalanine 5.8 10 1 G glycine 5.8 10 1 H histidine 0.0 0 0 I isoleucine 5.2 9 1 K lysine 14.0 24 2 L leucine 7.6 13 1 M methionine 5.8 10 1 N asparagine 2.9 5 1 P proline 1.7 3 1 Q glutamine 3.5 6 1 R arginine 4.1 7 1 S serine 5.8 10 3 T threonine 5.8 10 1 V valine 2.9 5 1 W tryptophan 0.0 0 0 Y tyrosine 0.6 1 1 |
Comparative genomics:
Search single species RefSeq proteins at NCBI
Search summary 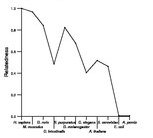
Figure data | ||
Related human proteins:Protein Relative score Description Self-match 1.000 caltractin CETN1 0.868 centrin 1 CETN3 0.508 centrin 3 CALM3 0.408 calmodulin 3 CALM2 0.408 calmodulin 2 CALM1 0.408 calmodulin 1 CALML3 0.386 calmodulin-like 3 TNNC2 0.309 fast skeletal muscle troponin C TNNC1 0.277 troponin C, slow CALML5 0.264 calmodulin-like 5 CALML4 0.225 calmodulin-like 4 isoform 1 CALML6 0.222 calmodulin-like 6 CABP5 0.212 calcium binding protein 5 MYL12A 0.206 myosin, light chain 12A, regulatory, non-sarcomeric [... MYL9 0.203 myosin regulatory light chain 9 isoform a CABP2 0.199 calcium binding protein 2 isoform 2 CABP1 0.196 calcium binding protein 1 isoform 1 CABP2 0.196 calcium binding protein 2 isoform 1 MYL12B 0.190 myosin regulatory light chain MRCL2 isoform A [Homo... MYL12B 0.190 myosin regulatory light chain MRCL2 isoform A [Homo... MYL12B 0.190 myosin regulatory light chain MRCL2 isoform A CABP1 0.190 calcium binding protein 1 isoform 3 CABP1 0.190 calcium binding protein 1 isoform 2 MYL12B 0.190 myosin regulatory light chain MRCL2 isoform B [Homo... CABP4 0.190 calcium binding protein 4 MYL5 0.183 myosin regulatory light chain 5 EFCAB2 0.174 EF-hand calcium binding domain 2 isoform a MYL6B 0.164 smooth muscle and non-muscle myosin alkali light chai... MYL6 0.161 myosin, light chain 6, alkali, smooth muscle and non... MYL1 0.161 fast skeletal myosin alkali light chain 1 isoform 1f...Human BLASTP results (used to prepare the table) | |||
Gene descriptions are from NCBI RefSeq. Search results were obtained with NCBI BLAST and RefSeq entries. When identical proteins are present, the self-match may not be listed first in BLASTP output. In such cases, the table above has been reordered to place it first.
See About the Figures for the scoring system used in the figure above right. The same scoring system was used in the table of BLASTP results.
Guide to the Human Genome
Copyright © 2010 by Stewart Scherer. All rights reserved.
