| Name: E2F3 | Sequence: fasta or formatted (465aa) | NCBI GI: 4503433 | |
|
Description: E2F transcription factor 3
|
Referenced in:
| ||
|
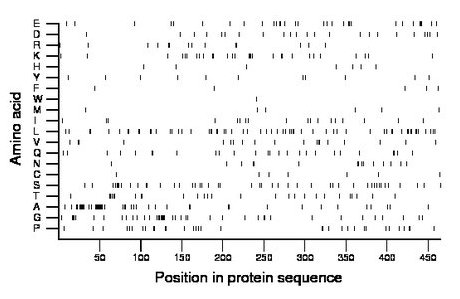
Composition:

Amino acid Percentage Count Longest homopolymer A alanine 9.5 44 9 C cysteine 1.5 7 1 D aspartate 4.9 23 1 E glutamate 6.7 31 3 F phenylalanine 1.1 5 1 G glycine 8.8 41 5 H histidine 1.5 7 1 I isoleucine 3.9 18 1 K lysine 6.2 29 3 L leucine 13.1 61 2 M methionine 1.5 7 1 N asparagine 3.2 15 2 P proline 7.1 33 2 Q glutamine 5.6 26 2 R arginine 3.0 14 2 S serine 9.9 46 3 T threonine 5.8 27 2 V valine 4.1 19 2 W tryptophan 0.2 1 1 Y tyrosine 2.4 11 1 |
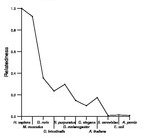
Comparative genomics:
Search single species RefSeq proteins at NCBI
Search summary 
Figure data | ||
Related human proteins:Protein Relative score Description Self-match 1.000 E2F transcription factor 3 E2F2 0.333 E2F transcription factor 2 E2F1 0.284 E2F transcription factor 1 E2F6 0.182 E2F transcription factor 6 E2F5 0.149 E2F transcription factor 5 isoform 2 E2F5 0.148 E2F transcription factor 5 isoform 1 E2F4 0.146 E2F transcription factor 4 E2F5 0.039 E2F transcription factor 5 isoform 3 E2F8 0.039 E2F family member 8 E2F7 0.033 E2F transcription factor 7 HOXD13 0.025 homeobox D13 POU3F3 0.020 POU class 3 homeobox 3 MLL 0.018 myeloid/lymphoid or mixed-lineage leukemia protein [... EOMES 0.018 eomesodermin TFDP1 0.017 transcription factor Dp-1 CACNG8 0.017 voltage-dependent calcium channel gamma-8 subunit [H... FOXF2 0.017 forkhead box F2 AMOT 0.017 angiomotin isoform 2 TNRC18 0.017 trinucleotide repeat containing 18 AMOT 0.017 angiomotin isoform 1 BARX1 0.017 BarH-like homeobox 1 FAM48B1 0.017 hypothetical protein LOC100130302 EVX2 0.016 even-skipped homeobox 2 NOVA2 0.016 neuro-oncological ventral antigen 2 LOC100294444 0.015 PREDICTED: similar to family with sequence similari... OTX1 0.015 orthodenticle homeobox 1 FAM48B2 0.015 family with sequence similarity 48, member B2 [Homo... SHANK1 0.015 SH3 and multiple ankyrin repeat domains 1 SP8 0.015 Sp8 transcription factor isoform 1 SP8 0.015 Sp8 transcription factor isoform 2Human BLASTP results (used to prepare the table) | |||
Gene descriptions are from NCBI RefSeq. Search results were obtained with NCBI BLAST and RefSeq entries. When identical proteins are present, the self-match may not be listed first in BLASTP output. In such cases, the table above has been reordered to place it first.
See About the Figures for the scoring system used in the figure above right. The same scoring system was used in the table of BLASTP results.
Guide to the Human Genome
Copyright © 2010 by Stewart Scherer. All rights reserved.
