
| Name: E2F1 | Sequence: fasta or formatted (437aa) | NCBI GI: 12669911 | |
|
Description: E2F transcription factor 1
|
Referenced in: E2F Pathways
| ||
|
Composition:
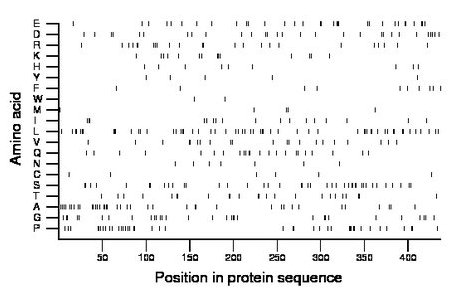
Amino acid Percentage Count Longest homopolymer A alanine 8.9 39 2 C cysteine 1.4 6 1 D aspartate 6.6 29 1 E glutamate 7.3 32 3 F phenylalanine 2.3 10 1 G glycine 7.1 31 2 H histidine 2.1 9 1 I isoleucine 3.9 17 2 K lysine 3.2 14 2 L leucine 13.0 57 3 M methionine 1.1 5 1 N asparagine 1.6 7 1 P proline 9.4 41 3 Q glutamine 5.3 23 2 R arginine 5.5 24 2 S serine 9.4 41 2 T threonine 5.5 24 2 V valine 4.8 21 2 W tryptophan 0.5 2 1 Y tyrosine 1.1 5 1 |
Comparative genomics:
Search single species RefSeq proteins at NCBI
Search summary 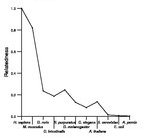
Figure data | ||
Related human proteins:Protein Relative score Description Self-match 1.000 E2F transcription factor 1 E2F3 0.300 E2F transcription factor 3 E2F2 0.286 E2F transcription factor 2 E2F6 0.160 E2F transcription factor 6 E2F5 0.144 E2F transcription factor 5 isoform 2 E2F5 0.141 E2F transcription factor 5 isoform 1 E2F4 0.133 E2F transcription factor 4 E2F5 0.037 E2F transcription factor 5 isoform 3 E2F8 0.036 E2F family member 8 E2F7 0.030 E2F transcription factor 7 BAT2D1 0.019 HBxAg transactivated protein 2 KRTAP4-6 0.018 PREDICTED: keratin associated protein 4.6 LIX1L 0.018 Lix1 homolog (mouse) like AKT1S1 0.018 AKT1 substrate 1 (proline-rich) AKT1S1 0.018 AKT1 substrate 1 (proline-rich) AKT1S1 0.018 AKT1 substrate 1 (proline-rich) TFDP1 0.018 transcription factor Dp-1 SCLT1 0.018 sodium channel associated protein 1 DSCAML1 0.017 Down syndrome cell adhesion molecule like 1 SFPQ 0.017 splicing factor proline/glutamine rich (polypyrimidin... TAF4 0.017 TBP-associated factor 4 BAT2 0.017 HLA-B associated transcript-2 CPSF6 0.015 cleavage and polyadenylation specific factor 6, 68 ... FLJ22184 0.015 PREDICTED: hypothetical protein FLJ22184 FLJ22184 0.015 PREDICTED: hypothetical protein LOC80164 BRD8 0.015 bromodomain containing 8 isoform 1 TNRC18 0.014 trinucleotide repeat containing 18 WHAMM 0.014 WAS protein homolog associated with actin, golgi me... LBXCOR1 0.014 LBXCOR1 homolog SPEG 0.014 SPEG complex locusHuman BLASTP results (used to prepare the table) | |||
Gene descriptions are from NCBI RefSeq. Search results were obtained with NCBI BLAST and RefSeq entries. When identical proteins are present, the self-match may not be listed first in BLASTP output. In such cases, the table above has been reordered to place it first.
See About the Figures for the scoring system used in the figure above right. The same scoring system was used in the table of BLASTP results.
Guide to the Human Genome
Copyright © 2010 by Stewart Scherer. All rights reserved.
