
| Name: E2F2 | Sequence: fasta or formatted (437aa) | NCBI GI: 4758226 | |
|
Description: E2F transcription factor 2
|
Referenced in:
| ||
|
Composition:
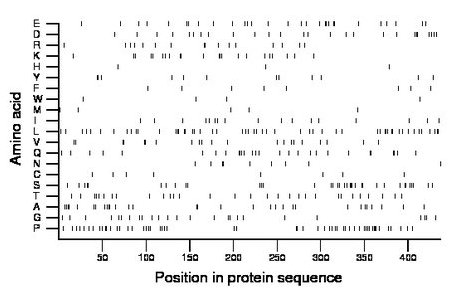
Amino acid Percentage Count Longest homopolymer A alanine 7.1 31 3 C cysteine 1.8 8 1 D aspartate 5.9 26 2 E glutamate 6.6 29 2 F phenylalanine 1.8 8 1 G glycine 5.7 25 1 H histidine 0.7 3 1 I isoleucine 3.9 17 1 K lysine 5.0 22 2 L leucine 12.1 53 2 M methionine 1.1 5 1 N asparagine 2.1 9 2 P proline 12.4 54 4 Q glutamine 6.4 28 3 R arginine 3.7 16 2 S serine 8.2 36 3 T threonine 6.9 30 1 V valine 4.8 21 2 W tryptophan 0.9 4 1 Y tyrosine 2.7 12 2 |
Comparative genomics:
Search single species RefSeq proteins at NCBI
Search summary 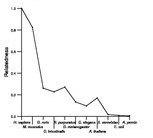
Figure data | ||
Related human proteins:Protein Relative score Description Self-match 1.000 E2F transcription factor 2 E2F3 0.343 E2F transcription factor 3 E2F1 0.280 E2F transcription factor 1 E2F6 0.189 E2F transcription factor 6 E2F4 0.165 E2F transcription factor 4 E2F5 0.161 E2F transcription factor 5 isoform 1 E2F5 0.159 E2F transcription factor 5 isoform 2 E2F5 0.055 E2F transcription factor 5 isoform 3 E2F7 0.038 E2F transcription factor 7 E2F8 0.034 E2F family member 8 GP1BA 0.030 platelet glycoprotein Ib alpha polypeptide precurso... PRR12 0.029 proline rich 12 WASF2 0.024 WAS protein family, member 2 ZNF828 0.023 zinc finger protein 828 FMNL1 0.023 formin-like 1 FLJ22184 0.023 PREDICTED: hypothetical protein FLJ22184 FLJ22184 0.022 PREDICTED: hypothetical protein FLJ22184 FLJ22184 0.022 PREDICTED: hypothetical protein LOC80164 SALL3 0.022 sal-like 3 PRDM2 0.022 retinoblastoma protein-binding zinc finger protein i... PRDM2 0.022 retinoblastoma protein-binding zinc finger protein i... PRDM2 0.022 retinoblastoma protein-binding zinc finger protein i... MUC2 0.021 mucin 2 precursor ZFPM1 0.020 zinc finger protein, multitype 1 CAMTA2 0.020 calmodulin binding transcription activator 2 MAMSTR 0.020 MEF2 activating motif and SAP domain containing tra... MAMSTR 0.020 MEF2 activating motif and SAP domain containing tran... LOC284297 0.019 hypothetical protein LOC284297 TTN 0.019 titin isoform N2-A EP300 0.019 E1A binding protein p300Human BLASTP results (used to prepare the table) | |||
Gene descriptions are from NCBI RefSeq. Search results were obtained with NCBI BLAST and RefSeq entries. When identical proteins are present, the self-match may not be listed first in BLASTP output. In such cases, the table above has been reordered to place it first.
See About the Figures for the scoring system used in the figure above right. The same scoring system was used in the table of BLASTP results.
Guide to the Human Genome
Copyright © 2010 by Stewart Scherer. All rights reserved.
