
| Name: E2F8 | Sequence: fasta or formatted (867aa) | NCBI GI: 38505226 | |
|
Description: E2F family member 8
|
Referenced in:
| ||
|
Composition:
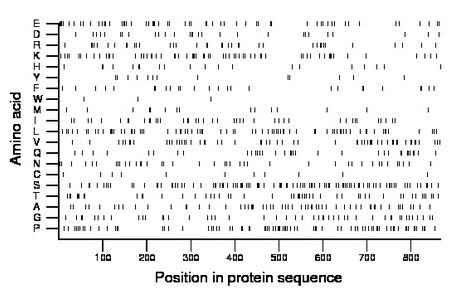
Amino acid Percentage Count Longest homopolymer A alanine 6.8 59 2 C cysteine 1.3 11 1 D aspartate 3.2 28 1 E glutamate 6.8 59 2 F phenylalanine 3.0 26 2 G glycine 5.5 48 2 H histidine 2.3 20 1 I isoleucine 4.8 42 2 K lysine 7.4 64 3 L leucine 8.4 73 2 M methionine 1.8 16 2 N asparagine 4.8 42 2 P proline 9.1 79 2 Q glutamine 3.9 34 2 R arginine 4.5 39 3 S serine 12.0 104 3 T threonine 5.9 51 2 V valine 6.5 56 1 W tryptophan 0.3 3 1 Y tyrosine 1.5 13 1 |
Comparative genomics:
Search single species RefSeq proteins at NCBI
Search summary 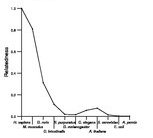
Figure data | ||
Related human proteins:Protein Relative score Description Self-match 1.000 E2F family member 8 E2F7 0.215 E2F transcription factor 7 E2F3 0.021 E2F transcription factor 3 E2F1 0.018 E2F transcription factor 1 LOC647546 0.017 PREDICTED: hypothetical protein E2F2 0.017 E2F transcription factor 2 E2F4 0.017 E2F transcription factor 4 E2F5 0.016 E2F transcription factor 5 isoform 2 E2F5 0.016 E2F transcription factor 5 isoform 1 TMEM108 0.016 transmembrane protein 108 TMEM108 0.016 transmembrane protein 108 MKL1 0.015 megakaryoblastic leukemia 1 protein SRCAP 0.015 Snf2-related CBP activator protein PRG4 0.013 proteoglycan 4 isoform D PRG4 0.013 proteoglycan 4 isoform C PRG4 0.013 proteoglycan 4 isoform B PRG4 0.013 proteoglycan 4 isoform A E2F6 0.013 E2F transcription factor 6 NOLC1 0.013 nucleolar and coiled-body phosphoprotein 1 MUC17 0.013 mucin 17 MUC16 0.012 mucin 16 AUTS2 0.012 autism susceptibility candidate 2 isoform 2 AUTS2 0.012 autism susceptibility candidate 2 isoform 1 NACA 0.012 nascent polypeptide-associated complex alpha subuni... MDC1 0.011 mediator of DNA-damage checkpoint 1 FLJ22184 0.011 PREDICTED: hypothetical protein FLJ22184 SRRM2 0.011 splicing coactivator subunit SRm300 ARID1A 0.011 AT rich interactive domain 1A isoform a ARID1A 0.011 AT rich interactive domain 1A isoform b MUC6 0.011 mucin 6, gastricHuman BLASTP results (used to prepare the table) | |||
Gene descriptions are from NCBI RefSeq. Search results were obtained with NCBI BLAST and RefSeq entries. When identical proteins are present, the self-match may not be listed first in BLASTP output. In such cases, the table above has been reordered to place it first.
See About the Figures for the scoring system used in the figure above right. The same scoring system was used in the table of BLASTP results.
Guide to the Human Genome
Copyright © 2010 by Stewart Scherer. All rights reserved.
