
| Name: TFDP1 | Sequence: fasta or formatted (410aa) | NCBI GI: 6005900 | |
|
Description: transcription factor Dp-1
|
Referenced in:
| ||
|
Composition:
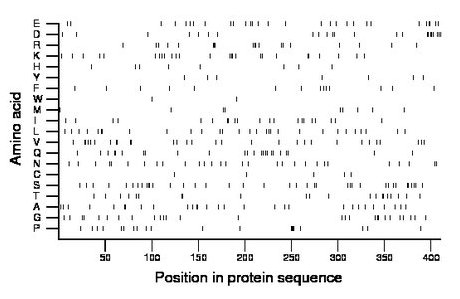
Amino acid Percentage Count Longest homopolymer A alanine 7.1 29 2 C cysteine 1.2 5 1 D aspartate 5.6 23 3 E glutamate 7.1 29 2 F phenylalanine 3.4 14 1 G glycine 6.6 27 2 H histidine 2.0 8 1 I isoleucine 5.1 21 2 K lysine 6.3 26 2 L leucine 7.1 29 2 M methionine 2.2 9 1 N asparagine 7.1 29 1 P proline 4.9 20 4 Q glutamine 5.9 24 2 R arginine 4.6 19 3 S serine 9.3 38 2 T threonine 5.1 21 2 V valine 7.3 30 2 W tryptophan 0.5 2 1 Y tyrosine 1.7 7 1 |
Comparative genomics:
Search single species RefSeq proteins at NCBI
Search summary 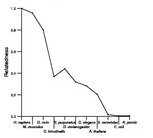
Figure data | ||
Related human proteins:Protein Relative score Description Self-match 1.000 transcription factor Dp-1 TFDP3 0.695 transcription factor Dp family, member 3 TFDP2 0.522 transcription factor Dp-2 (E2F dimerization partner 2... E2F4 0.020 E2F transcription factor 4 E2F3 0.019 E2F transcription factor 3 E2F1 0.019 E2F transcription factor 1 GCOM1 0.018 GRINL1A combined protein isoform 2 GCOM1 0.018 GRINL1A combined protein isoform 1 GCOM1 0.018 GRINL1A combined protein isoform 8 GCOM1 0.018 GRINL1A upstream protein isoform 7 E2F5 0.015 E2F transcription factor 5 isoform 2 E2F5 0.015 E2F transcription factor 5 isoform 1 MLL3 0.013 myeloid/lymphoid or mixed-lineage leukemia 3 E2F2 0.011 E2F transcription factor 2 E2F7 0.011 E2F transcription factor 7 IVL 0.011 involucrin MYH11 0.011 smooth muscle myosin heavy chain 11 isoform SM1A [Ho... MYH11 0.011 smooth muscle myosin heavy chain 11 isoform SM1B [Ho... MYH11 0.011 smooth muscle myosin heavy chain 11 isoform SM2B [Ho... MYH11 0.011 smooth muscle myosin heavy chain 11 isoform SM2A [Ho... E2F6 0.010 E2F transcription factor 6 TAF4B 0.010 TAF4b RNA polymerase II, TATA box binding protein (... RBM33 0.009 RNA binding motif protein 33 E2F8 0.009 E2F family member 8 CEP120 0.009 coiled-coil domain containing 100 ZNF853 0.009 zinc finger protein 853 LOC653125 0.008 PREDICTED: similar to Golgin subfamily A member 8-l... LOC653125 0.008 PREDICTED: similar to Golgin subfamily A member 8-l... LOC728498 0.008 PREDICTED: similar to Golgin subfamily A member 8-l... LOC728498 0.008 PREDICTED: similar to Golgin subfamily A member 8-l...Human BLASTP results (used to prepare the table) | |||
Gene descriptions are from NCBI RefSeq. Search results were obtained with NCBI BLAST and RefSeq entries. When identical proteins are present, the self-match may not be listed first in BLASTP output. In such cases, the table above has been reordered to place it first.
See About the Figures for the scoring system used in the figure above right. The same scoring system was used in the table of BLASTP results.
Guide to the Human Genome
Copyright © 2010 by Stewart Scherer. All rights reserved.
