
| Name: S100A7 | Sequence: fasta or formatted (101aa) | NCBI GI: 115298657 | |
|
Description: S100 calcium binding protein A7
|
Referenced in:
| ||
|
Composition:
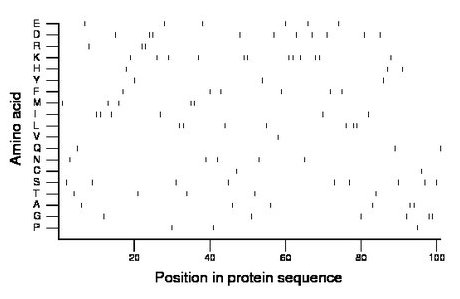
Amino acid Percentage Count Longest homopolymer A alanine 5.9 6 2 C cysteine 2.0 2 1 D aspartate 9.9 10 2 E glutamate 5.9 6 1 F phenylalanine 5.9 6 1 G glycine 5.9 6 2 H histidine 3.0 3 1 I isoleucine 5.9 6 2 K lysine 11.9 12 2 L leucine 6.9 7 2 M methionine 5.0 5 2 N asparagine 5.0 5 1 P proline 3.0 3 1 Q glutamine 3.0 3 1 R arginine 3.0 3 2 S serine 8.9 9 1 T threonine 5.0 5 1 V valine 1.0 1 1 W tryptophan 0.0 0 0 Y tyrosine 3.0 3 1 |
Comparative genomics:
Search single species RefSeq proteins at NCBI
Search summary 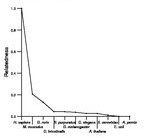
Figure data | ||
Related human proteins:Protein Relative score Description Self-match 1.000 S100 calcium binding protein A7 S100A7A 0.924 S100 calcium binding protein A7-like 1 S100A7L2 0.516 S100 calcium binding protein A7-like 2 S100A11 0.136 S100 calcium binding protein A11 S100A12 0.120 S100 calcium-binding protein A12 S100A9 0.114 S100 calcium-binding protein A9 S100B 0.103 S100 calcium-binding protein, beta S100Z 0.103 S100 calcium binding protein Z S100G 0.098 calbindin 3 S100A16 0.092 S100 calcium binding protein A16 S100A8 0.092 S100 calcium-binding protein A8 FLG 0.092 filaggrin FLG2 0.087 filaggrin family member 2 S100P 0.082 S100 calcium binding protein P S100A6 0.076 S100 calcium-binding protein A6 S100A4 0.071 S100 calcium-binding protein A4 S100A4 0.071 S100 calcium-binding protein A4 S100A10 0.071 S100 calcium binding protein A10 S100A5 0.065 S100 calcium binding protein A5 S100A2 0.065 S100 calcium binding protein A2 S100A13 0.054 S100 calcium binding protein A13 S100A13 0.054 S100 calcium binding protein A13 S100A13 0.054 S100 calcium binding protein A13 S100A13 0.054 S100 calcium binding protein A13 S100A13 0.054 S100 calcium binding protein A13 RPTN 0.054 repetin S100A1 0.054 S100 calcium binding protein A1 HRNR 0.054 hornerin SNTN 0.043 sentan, cilia apical structure protein GUCA1B 0.038 guanylate cyclase activator 1B (retina)Human BLASTP results (used to prepare the table) | |||
Gene descriptions are from NCBI RefSeq. Search results were obtained with NCBI BLAST and RefSeq entries. When identical proteins are present, the self-match may not be listed first in BLASTP output. In such cases, the table above has been reordered to place it first.
See About the Figures for the scoring system used in the figure above right. The same scoring system was used in the table of BLASTP results.
Guide to the Human Genome
Copyright © 2010 by Stewart Scherer. All rights reserved.
