
| Name: TP53I13 | Sequence: fasta or formatted (393aa) | NCBI GI: 114431216 | |
|
Description: tumor protein p53 inducible protein 13
|
Referenced in:
| ||
|
Composition:
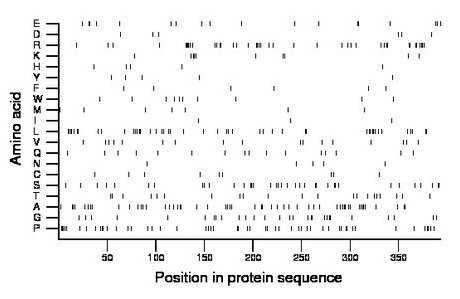
Amino acid Percentage Count Longest homopolymer A alanine 13.5 53 3 C cysteine 2.3 9 1 D aspartate 1.5 6 1 E glutamate 4.6 18 2 F phenylalanine 1.5 6 1 G glycine 7.1 28 2 H histidine 1.3 5 1 I isoleucine 0.8 3 1 K lysine 2.5 10 3 L leucine 11.7 46 4 M methionine 1.8 7 1 N asparagine 1.3 5 1 P proline 13.0 51 4 Q glutamine 4.1 16 1 R arginine 10.4 41 5 S serine 9.2 36 3 T threonine 5.3 21 1 V valine 4.3 17 1 W tryptophan 2.5 10 1 Y tyrosine 1.3 5 1 |
Comparative genomics:
Search single species RefSeq proteins at NCBI
Search summary 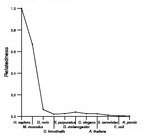
Figure data | ||
Related human proteins:Protein Relative score Description Self-match 1.000 tumor protein p53 inducible protein 13 FLJ22184 0.023 PREDICTED: hypothetical protein LOC80164 BCAN 0.023 brevican isoform 2 FOXD1 0.022 forkhead box D1 TMPRSS13 0.022 transmembrane protease, serine 13 CASKIN1 0.021 CASK interacting protein 1 SALL3 0.021 sal-like 3 LOC100292122 0.021 PREDICTED: hypothetical protein XP_002345138 LOC100133756 0.019 PREDICTED: hypothetical protein, partial NACA 0.019 nascent polypeptide-associated complex alpha subuni... TAF4 0.019 TBP-associated factor 4 COL2A1 0.018 collagen, type II, alpha 1 isoform 1 precursor [Hom... COL2A1 0.018 collagen, type II, alpha 1 isoform 2 precursor [Hom... AGAP2 0.018 centaurin, gamma 1 isoform PIKE-L LOC100291609 0.018 PREDICTED: hypothetical protein XP_002346061 LOC100286986 0.018 PREDICTED: hypothetical protein XP_002344191 KIF26A 0.018 kinesin family member 26A LOC100134365 0.017 PREDICTED: similar to ankyrin repeat domain 36 [Hom... MAP1S 0.017 BPY2 interacting protein 1 PRR18 0.017 proline rich region 18 ANKRD36 0.017 PREDICTED: ankyrin repeat domain 36 MUC4 0.017 mucin 4 isoform a COL1A2 0.015 alpha 2 type I collagen LOC100293055 0.015 PREDICTED: similar to COL22A1 protein ZNF469 0.015 zinc finger protein 469 TBC1D10B 0.015 TBC1 domain family, member 10B PRB1 0.015 proline-rich protein BstNI subfamily 1 isoform 2 pre... COL22A1 0.015 collagen, type XXII, alpha 1 BIN2 0.015 bridging integrator 2 LOC652586 0.015 PREDICTED: similar to facioscapulohumeral muscular ...Human BLASTP results (used to prepare the table) | |||
Gene descriptions are from NCBI RefSeq. Search results were obtained with NCBI BLAST and RefSeq entries. When identical proteins are present, the self-match may not be listed first in BLASTP output. In such cases, the table above has been reordered to place it first.
See About the Figures for the scoring system used in the figure above right. The same scoring system was used in the table of BLASTP results.
Guide to the Human Genome
Copyright © 2010 by Stewart Scherer. All rights reserved.
