
| Name: LOC100132213 | Sequence: fasta or formatted (131aa) | NCBI GI: 169166227 | |
|
Description: PREDICTED: hypothetical protein
| Not currently referenced in the text | ||
|
Composition:
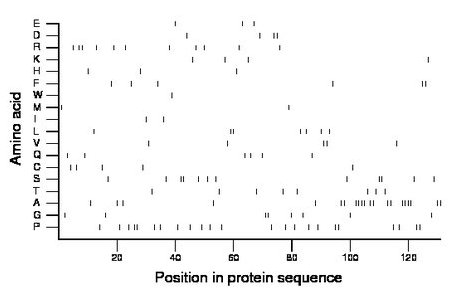
Amino acid Percentage Count Longest homopolymer A alanine 16.0 21 4 C cysteine 3.8 5 1 D aspartate 3.1 4 2 E glutamate 2.3 3 1 F phenylalanine 4.6 6 2 G glycine 6.1 8 2 H histidine 2.3 3 1 I isoleucine 1.5 2 1 K lysine 3.1 4 1 L leucine 5.3 7 2 M methionine 1.5 2 1 N asparagine 0.0 0 0 P proline 17.6 23 2 Q glutamine 4.6 6 1 R arginine 8.4 11 2 S serine 9.2 12 2 T threonine 6.1 8 1 V valine 3.8 5 2 W tryptophan 0.8 1 1 Y tyrosine 0.0 0 0 |
Comparative genomics:
Search single species RefSeq proteins at NCBI
Search summary 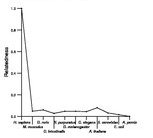
Figure data | ||
Related human proteins:Protein Relative score Description Self-match 1.000 PREDICTED: hypothetical protein LOC100128869 0.968 PREDICTED: hypothetical protein LOC100132829 0.960 PREDICTED: hypothetical protein LOC100131722 0.956 PREDICTED: hypothetical protein LOC100128869 0.956 PREDICTED: hypothetical protein LOC100129002 0.948 PREDICTED: hypothetical protein LOC100132315 0.948 PREDICTED: hypothetical protein LOC100131722 0.940 PREDICTED: hypothetical protein LOC100132752 0.940 PREDICTED: hypothetical protein LOC100131591 0.940 PREDICTED: hypothetical protein LOC100131591 0.932 PREDICTED: hypothetical protein LOC100132483 0.932 PREDICTED: hypothetical protein LOC100133270 0.928 PREDICTED: hypothetical protein LOC100132410 0.928 PREDICTED: hypothetical protein LOC100133002 0.928 PREDICTED: hypothetical protein LOC100132117 0.928 PREDICTED: hypothetical protein LOC100133083 0.924 PREDICTED: hypothetical protein LOC100131850 0.920 PREDICTED: hypothetical protein LOC100131968 0.900 PREDICTED: hypothetical protein LOC100131850 0.761 PREDICTED: hypothetical protein LOC389333 0.056 hypothetical protein LOC389333 MAP7 0.048 microtubule-associated protein 7 PDLIM5 0.048 PDZ and LIM domain 5 isoform a LOC285556 0.044 PREDICTED: hypothetical protein LOC285556 LOC285556 0.044 PREDICTED: hypothetical protein LOC285556 LOC285556 0.044 PREDICTED: hypothetical protein LOC285556 AMOT 0.044 angiomotin isoform 2 AMOT 0.044 angiomotin isoform 1 C2orf55 0.044 hypothetical protein LOC343990 BCORL1 0.044 BCL6 co-repressor-like 1Human BLASTP results (used to prepare the table) | |||
Gene descriptions are from NCBI RefSeq. Search results were obtained with NCBI BLAST and RefSeq entries. When identical proteins are present, the self-match may not be listed first in BLASTP output. In such cases, the table above has been reordered to place it first.
See About the Figures for the scoring system used in the figure above right. The same scoring system was used in the table of BLASTP results.
Guide to the Human Genome
Copyright © 2010 by Stewart Scherer. All rights reserved.
