
| Name: TNKS1BP1 | Sequence: fasta or formatted (1729aa) | NCBI GI: 110556636 | |
|
Description: tankyrase 1-binding protein 1
|
Referenced in:
| ||
|
Composition:
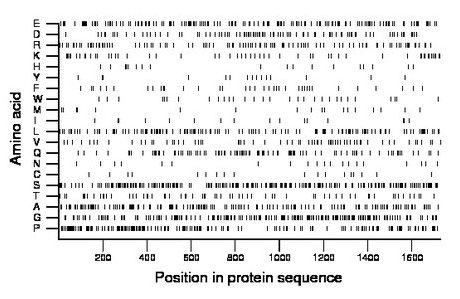
Amino acid Percentage Count Longest homopolymer A alanine 9.2 159 2 C cysteine 1.0 18 1 D aspartate 5.3 92 2 E glutamate 9.4 162 3 F phenylalanine 2.1 37 1 G glycine 12.0 207 3 H histidine 1.1 19 2 I isoleucine 1.0 17 2 K lysine 3.5 60 4 L leucine 7.8 134 2 M methionine 1.1 19 1 N asparagine 1.2 21 2 P proline 10.2 177 3 Q glutamine 5.8 100 3 R arginine 6.3 109 2 S serine 12.5 216 4 T threonine 4.0 69 3 V valine 3.9 68 2 W tryptophan 1.7 30 1 Y tyrosine 0.9 15 1 |
Comparative genomics:
Search single species RefSeq proteins at NCBI
Search summary 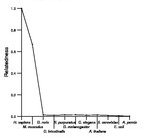
Figure data | ||
Related human proteins:Protein Relative score Description Self-match 1.000 tankyrase 1-binding protein 1 PRG4 0.018 proteoglycan 4 isoform D PRG4 0.018 proteoglycan 4 isoform C PRG4 0.018 proteoglycan 4 isoform B PRG4 0.018 proteoglycan 4 isoform A KIAA1671 0.016 hypothetical protein LOC85379 NACA 0.016 nascent polypeptide-associated complex alpha subuni... PCLO 0.016 piccolo isoform 2 PCLO 0.016 piccolo isoform 1 FLJ22184 0.014 PREDICTED: hypothetical protein FLJ22184 FLJ22184 0.014 PREDICTED: hypothetical protein LOC80164 FLJ22184 0.014 PREDICTED: hypothetical protein FLJ22184 HRNR 0.014 hornerin KIAA0754 0.013 hypothetical protein LOC643314 C6orf132 0.013 PREDICTED: chromosome 6 open reading frame 132 [Hom... C6orf132 0.013 PREDICTED: chromosome 6 open reading frame 132 [Hom... C6orf132 0.013 PREDICTED: hypothetical protein LOC647024 MLL2 0.013 myeloid/lymphoid or mixed-lineage leukemia 2 CASKIN2 0.012 cask-interacting protein 2 isoform b CASKIN2 0.012 cask-interacting protein 2 isoform a SAMD1 0.011 sterile alpha motif domain containing 1 TNRC18 0.011 trinucleotide repeat containing 18 RP1L1 0.011 retinitis pigmentosa 1-like 1 COL1A1 0.011 alpha 1 type I collagen preproprotein FLG 0.011 filaggrin RERE 0.011 atrophin-1 like protein isoform b RERE 0.011 atrophin-1 like protein isoform a RERE 0.011 atrophin-1 like protein isoform a BAT2 0.011 HLA-B associated transcript-2 ATN1 0.011 atrophin-1Human BLASTP results (used to prepare the table) | |||
Gene descriptions are from NCBI RefSeq. Search results were obtained with NCBI BLAST and RefSeq entries. When identical proteins are present, the self-match may not be listed first in BLASTP output. In such cases, the table above has been reordered to place it first.
See About the Figures for the scoring system used in the figure above right. The same scoring system was used in the table of BLASTP results.
Guide to the Human Genome
Copyright © 2010 by Stewart Scherer. All rights reserved.
