
| Name: C18orf10 | Sequence: fasta or formatted (300aa) | NCBI GI: 68534957 | |
|
Description: tubulin polyglutamylase complex subunit 2
|
Referenced in:
| ||
|
Composition:
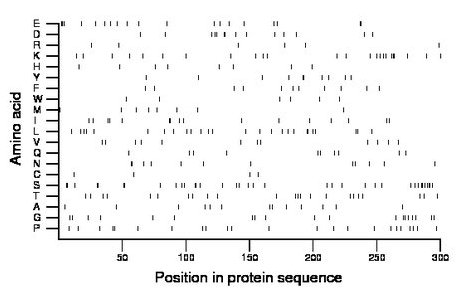
Amino acid Percentage Count Longest homopolymer A alanine 4.3 13 1 C cysteine 1.3 4 1 D aspartate 4.7 14 2 E glutamate 6.3 19 3 F phenylalanine 3.7 11 1 G glycine 6.3 19 2 H histidine 2.7 8 1 I isoleucine 5.3 16 2 K lysine 8.0 24 3 L leucine 8.7 26 2 M methionine 2.7 8 1 N asparagine 4.0 12 2 P proline 7.7 23 2 Q glutamine 3.3 10 1 R arginine 2.0 6 1 S serine 12.0 36 3 T threonine 7.7 23 1 V valine 4.0 12 1 W tryptophan 2.0 6 1 Y tyrosine 3.3 10 2 |
Comparative genomics:
Search single species RefSeq proteins at NCBI
Search summary 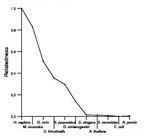
Figure data | ||
Related human proteins:Protein Relative score Description Self-match 1.000 tubulin polyglutamylase complex subunit 2 LOC651986 0.020 PREDICTED: similar to forkhead box L2 LOC100288524 0.020 PREDICTED: hypothetical protein XP_002342748 LOC651986 0.020 PREDICTED: similar to forkhead box L2 EMID2 0.020 EMI domain containing 2 COL5A3 0.019 collagen, type V, alpha 3 preproprotein COL3A1 0.015 collagen type III alpha 1 preproprotein LOC651986 0.015 PREDICTED: similar to forkhead box L2 COL11A2 0.015 collagen, type XI, alpha 2 isoform 2 preproprotein ... COL11A2 0.015 collagen, type XI, alpha 2 isoform 3 preproprotein ... COL11A2 0.015 collagen, type XI, alpha 2 isoform 1 preproprotein ... COLEC12 0.013 collectin sub-family member 12 COL1A2 0.013 alpha 2 type I collagen CNOT3 0.013 CCR4-NOT transcription complex, subunit 3 COL1A1 0.012 alpha 1 type I collagen preproprotein LOC100293055 0.012 PREDICTED: similar to COL22A1 protein ABI2 0.012 abl interactor 2 COL22A1 0.012 collagen, type XXII, alpha 1 RLIM 0.010 ring finger protein, LIM domain interacting RLIM 0.010 ring finger protein, LIM domain interacting SYN2 0.010 synapsin II isoform IIa CDSN 0.010 corneodesmosin precursor PPRC1 0.010 peroxisome proliferator-activated receptor gamma, co... UBQLN2 0.010 ubiquilin 2 AKAP11 0.010 A-kinase anchor protein 11 ANKRD43 0.010 ankyrin repeat domain 43 ATXN2L 0.010 ataxin 2 related protein isoform B ATXN2L 0.010 ataxin 2 related protein isoform E ATXN2L 0.010 ataxin 2 related protein isoform C ATXN2L 0.010 ataxin 2 related protein isoform AHuman BLASTP results (used to prepare the table) | |||
Gene descriptions are from NCBI RefSeq. Search results were obtained with NCBI BLAST and RefSeq entries. When identical proteins are present, the self-match may not be listed first in BLASTP output. In such cases, the table above has been reordered to place it first.
See About the Figures for the scoring system used in the figure above right. The same scoring system was used in the table of BLASTP results.
Guide to the Human Genome
Copyright © 2010 by Stewart Scherer. All rights reserved.
