
| Name: SOX13 | Sequence: fasta or formatted (622aa) | NCBI GI: 41406089 | |
|
Description: SRY-box 13
|
Referenced in:
| ||
|
Composition:
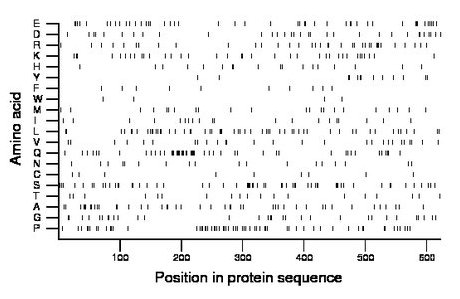
Amino acid Percentage Count Longest homopolymer A alanine 7.2 45 2 C cysteine 1.4 9 1 D aspartate 5.1 32 2 E glutamate 7.6 47 2 F phenylalanine 1.6 10 1 G glycine 5.1 32 2 H histidine 2.9 18 2 I isoleucine 3.2 20 1 K lysine 5.8 36 2 L leucine 9.0 56 2 M methionine 3.7 23 1 N asparagine 2.9 18 1 P proline 10.0 62 2 Q glutamine 8.4 52 4 R arginine 5.8 36 2 S serine 9.8 61 3 T threonine 3.1 19 1 V valine 4.7 29 2 W tryptophan 0.6 4 1 Y tyrosine 2.1 13 2 |
Comparative genomics:
Search single species RefSeq proteins at NCBI
Search summary 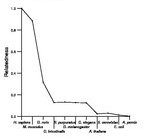
Figure data | ||
Related human proteins:Protein Relative score Description Self-match 1.000 SRY-box 13 SOX5 0.329 SRY (sex determining region Y)-box 5 isoform b [Homo... SOX5 0.329 SRY (sex determining region Y)-box 5 isoform a [Homo... SOX6 0.273 SRY (sex determining region Y)-box 6 isoform 3 [Hom... SOX6 0.273 SRY (sex determining region Y)-box 6 isoform 1 [Homo... SOX5 0.205 SRY (sex determining region Y)-box 5 isoform c [Homo... SOX6 0.172 SRY (sex determining region Y)-box 6 isoform 2 [Homo... SOX6 0.168 SRY (sex determining region Y)-box 6 isoform 4 [Hom... SOX17 0.072 SRY-box 17 SOX11 0.067 SRY-box 11 SOX14 0.067 SRY-box 14 SOX7 0.065 SRY-box 7 SOX12 0.065 SRY (sex determining region Y)-box 12 SOX4 0.064 SRY (sex determining region Y)-box 4 SOX18 0.063 SRY-box 18 SOX21 0.063 SRY-box 21 SOX1 0.061 SRY (sex determining region Y)-box 1 SOX9 0.061 transcription factor SOX9 SOX15 0.060 SRY-box 15 SOX2 0.059 sex-determining region Y-box 2 SOX3 0.059 SRY (sex determining region Y)-box 3 SOX10 0.058 SRY (sex determining region Y)-box 10 SOX8 0.058 SRY (sex determining region Y)-box 8 SRY 0.057 sex determining region Y SOX30 0.049 SRY (sex determining region Y)-box 30 isoform b [Homo... SOX30 0.049 SRY (sex determining region Y)-box 30 isoform a [Hom... CIC 0.046 capicua homolog TCF7L1 0.033 HMG-box transcription factor TCF-3 TCF7L2 0.032 transcription factor 7-like 2 isoform 4 TCF7L2 0.032 transcription factor 7-like 2 isoform 1Human BLASTP results (used to prepare the table) | |||
Gene descriptions are from NCBI RefSeq. Search results were obtained with NCBI BLAST and RefSeq entries. When identical proteins are present, the self-match may not be listed first in BLASTP output. In such cases, the table above has been reordered to place it first.
See About the Figures for the scoring system used in the figure above right. The same scoring system was used in the table of BLASTP results.
Guide to the Human Genome
Copyright © 2010 by Stewart Scherer. All rights reserved.
