
| Name: SOX3 | Sequence: fasta or formatted (446aa) | NCBI GI: 30061556 | |
|
Description: SRY (sex determining region Y)-box 3
|
Referenced in:
| ||
|
Composition:
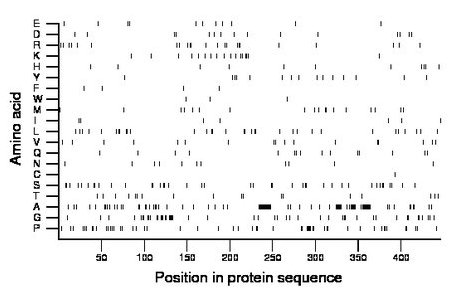
Amino acid Percentage Count Longest homopolymer A alanine 19.1 85 15 C cysteine 0.2 1 1 D aspartate 3.4 15 1 E glutamate 2.5 11 1 F phenylalanine 0.9 4 1 G glycine 10.8 48 5 H histidine 2.5 11 1 I isoleucine 1.6 7 1 K lysine 3.8 17 2 L leucine 7.4 33 2 M methionine 4.0 18 2 N asparagine 2.5 11 1 P proline 11.9 53 5 Q glutamine 3.4 15 2 R arginine 5.2 23 2 S serine 9.2 41 2 T threonine 4.0 18 1 V valine 3.8 17 2 W tryptophan 0.7 3 1 Y tyrosine 3.4 15 1 |
Comparative genomics:
Search single species RefSeq proteins at NCBI
Search summary 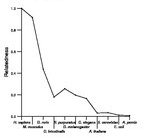
Figure data | ||
Related human proteins:Protein Relative score Description Self-match 1.000 SRY (sex determining region Y)-box 3 SOX1 0.420 SRY (sex determining region Y)-box 1 SOX2 0.364 sex-determining region Y-box 2 SOX21 0.179 SRY-box 21 SOX14 0.161 SRY-box 14 SOX15 0.139 SRY-box 15 SRY 0.131 sex determining region Y SOX17 0.124 SRY-box 17 SOX4 0.118 SRY (sex determining region Y)-box 4 SOX12 0.116 SRY (sex determining region Y)-box 12 SOX18 0.114 SRY-box 18 SOX11 0.113 SRY-box 11 SOX10 0.109 SRY (sex determining region Y)-box 10 SOX7 0.108 SRY-box 7 SOX8 0.103 SRY (sex determining region Y)-box 8 SOX9 0.098 transcription factor SOX9 SOX5 0.091 SRY (sex determining region Y)-box 5 isoform c [Homo... SOX5 0.091 SRY (sex determining region Y)-box 5 isoform b [Homo... SOX5 0.091 SRY (sex determining region Y)-box 5 isoform a [Homo... SOX6 0.085 SRY (sex determining region Y)-box 6 isoform 2 [Homo... SOX6 0.085 SRY (sex determining region Y)-box 6 isoform 4 [Hom... SOX6 0.085 SRY (sex determining region Y)-box 6 isoform 3 [Hom... SOX6 0.085 SRY (sex determining region Y)-box 6 isoform 1 [Homo... SOX13 0.084 SRY-box 13 SOX30 0.068 SRY (sex determining region Y)-box 30 isoform b [Homo... SOX30 0.068 SRY (sex determining region Y)-box 30 isoform a [Hom... CIC 0.065 capicua homolog EVX2 0.051 even-skipped homeobox 2 TCF7L2 0.044 transcription factor 7-like 2 isoform 2 TCF7L2 0.044 transcription factor 7-like 2 isoform 5Human BLASTP results (used to prepare the table) | |||
Gene descriptions are from NCBI RefSeq. Search results were obtained with NCBI BLAST and RefSeq entries. When identical proteins are present, the self-match may not be listed first in BLASTP output. In such cases, the table above has been reordered to place it first.
See About the Figures for the scoring system used in the figure above right. The same scoring system was used in the table of BLASTP results.
Guide to the Human Genome
Copyright © 2010 by Stewart Scherer. All rights reserved.
