
| Name: SRY | Sequence: fasta or formatted (204aa) | NCBI GI: 4507225 | |
|
Description: sex determining region Y
|
Referenced in: Gene Families
| ||
|
Composition:
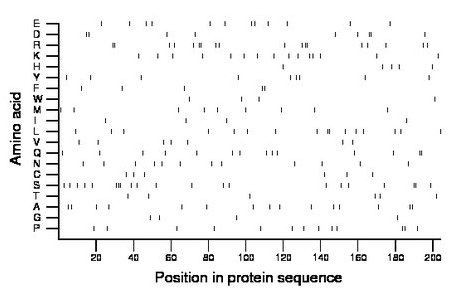
Amino acid Percentage Count Longest homopolymer A alanine 7.4 15 2 C cysteine 2.9 6 1 D aspartate 4.4 9 2 E glutamate 5.9 12 1 F phenylalanine 2.5 5 2 G glycine 2.0 4 1 H histidine 2.5 5 1 I isoleucine 2.0 4 1 K lysine 7.4 15 1 L leucine 7.8 16 2 M methionine 4.4 9 1 N asparagine 5.9 12 1 P proline 6.4 13 2 Q glutamine 6.9 14 2 R arginine 8.8 18 2 S serine 10.3 21 3 T threonine 2.9 6 1 V valine 3.4 7 1 W tryptophan 2.0 4 1 Y tyrosine 4.4 9 1 |
Comparative genomics:
Search single species RefSeq proteins at NCBI
Search summary 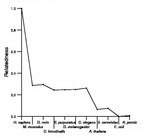
Figure data | ||
Related human proteins:Protein Relative score Description Self-match 1.000 sex determining region Y SOX3 0.284 SRY (sex determining region Y)-box 3 SOX2 0.264 sex-determining region Y-box 2 SOX1 0.259 SRY (sex determining region Y)-box 1 SOX21 0.249 SRY-box 21 SOX14 0.242 SRY-box 14 SOX15 0.227 SRY-box 15 SOX7 0.202 SRY-box 7 SOX17 0.202 SRY-box 17 SOX11 0.200 SRY-box 11 SOX18 0.187 SRY-box 18 SOX4 0.187 SRY (sex determining region Y)-box 4 SOX12 0.185 SRY (sex determining region Y)-box 12 SOX5 0.182 SRY (sex determining region Y)-box 5 isoform c [Homo... SOX5 0.182 SRY (sex determining region Y)-box 5 isoform b [Homo... SOX5 0.182 SRY (sex determining region Y)-box 5 isoform a [Homo... SOX6 0.180 SRY (sex determining region Y)-box 6 isoform 4 [Hom... SOX6 0.180 SRY (sex determining region Y)-box 6 isoform 3 [Hom... SOX6 0.180 SRY (sex determining region Y)-box 6 isoform 1 [Homo... SOX6 0.180 SRY (sex determining region Y)-box 6 isoform 2 [Homo... SOX9 0.177 transcription factor SOX9 SOX8 0.175 SRY (sex determining region Y)-box 8 SOX13 0.175 SRY-box 13 SOX10 0.175 SRY (sex determining region Y)-box 10 SOX30 0.160 SRY (sex determining region Y)-box 30 isoform b [Homo... SOX30 0.160 SRY (sex determining region Y)-box 30 isoform a [Hom... CIC 0.080 capicua homolog TCF7L2 0.070 transcription factor 7-like 2 isoform 5 TCF7L2 0.070 transcription factor 7-like 2 isoform 1 TCF7L2 0.070 transcription factor 7-like 2 isoform 2Human BLASTP results (used to prepare the table) | |||
Gene descriptions are from NCBI RefSeq. Search results were obtained with NCBI BLAST and RefSeq entries. When identical proteins are present, the self-match may not be listed first in BLASTP output. In such cases, the table above has been reordered to place it first.
See About the Figures for the scoring system used in the figure above right. The same scoring system was used in the table of BLASTP results.
Guide to the Human Genome
Copyright © 2010 by Stewart Scherer. All rights reserved.
