
| Name: SOX5 | Sequence: fasta or formatted (763aa) | NCBI GI: 23308713 | |
|
Description: SRY (sex determining region Y)-box 5 isoform a
|
Referenced in:
| ||
Other entries for this name:
alt prot [750aa] SRY (sex determining region Y)-box 5 isoform b alt prot [377aa] SRY (sex determining region Y)-box 5 isoform c | |||
|
Composition:
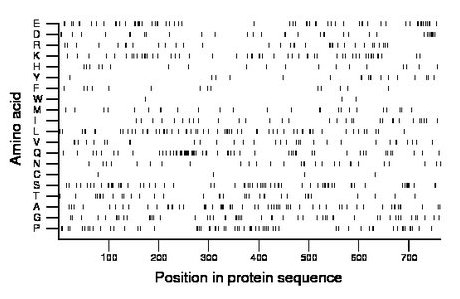
Amino acid Percentage Count Longest homopolymer A alanine 8.4 64 6 C cysteine 0.5 4 1 D aspartate 4.3 33 2 E glutamate 8.3 63 4 F phenylalanine 1.8 14 1 G glycine 6.7 51 2 H histidine 2.5 19 1 I isoleucine 4.1 31 1 K lysine 6.8 52 2 L leucine 8.3 63 2 M methionine 3.4 26 2 N asparagine 3.7 28 2 P proline 8.0 61 3 Q glutamine 8.4 64 4 R arginine 4.6 35 2 S serine 8.8 67 3 T threonine 4.5 34 2 V valine 4.3 33 2 W tryptophan 0.4 3 1 Y tyrosine 2.4 18 2 |
Comparative genomics:
Search single species RefSeq proteins at NCBI
Search summary 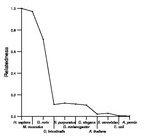
Figure data | ||
Related human proteins:Protein Relative score Description Self-match 1.000 SRY (sex determining region Y)-box 5 isoform a [Homo... SOX5 0.982 SRY (sex determining region Y)-box 5 isoform b [Homo... SOX6 0.549 SRY (sex determining region Y)-box 6 isoform 1 [Homo... SOX6 0.548 SRY (sex determining region Y)-box 6 isoform 3 [Hom... SOX6 0.544 SRY (sex determining region Y)-box 6 isoform 2 [Homo... SOX6 0.539 SRY (sex determining region Y)-box 6 isoform 4 [Hom... SOX5 0.488 SRY (sex determining region Y)-box 5 isoform c [Homo... SOX13 0.272 SRY-box 13 SOX17 0.058 SRY-box 17 SOX7 0.056 SRY-box 7 SOX9 0.056 transcription factor SOX9 SOX1 0.054 SRY (sex determining region Y)-box 1 SOX11 0.054 SRY-box 11 SOX14 0.054 SRY-box 14 SOX3 0.053 SRY (sex determining region Y)-box 3 SOX18 0.052 SRY-box 18 SOX12 0.052 SRY (sex determining region Y)-box 12 SOX4 0.052 SRY (sex determining region Y)-box 4 SOX21 0.052 SRY-box 21 SOX2 0.051 sex-determining region Y-box 2 SOX10 0.050 SRY (sex determining region Y)-box 10 SOX8 0.050 SRY (sex determining region Y)-box 8 SRY 0.049 sex determining region Y SOX15 0.049 SRY-box 15 SOX30 0.038 SRY (sex determining region Y)-box 30 isoform b [Homo... SOX30 0.038 SRY (sex determining region Y)-box 30 isoform a [Hom... CIC 0.031 capicua homolog MLL2 0.026 myeloid/lymphoid or mixed-lineage leukemia 2 LEF1 0.025 lymphoid enhancer-binding factor 1 isoform 3 TCF7L2 0.024 transcription factor 7-like 2 isoform 1Human BLASTP results (used to prepare the table) | |||
Gene descriptions are from NCBI RefSeq. Search results were obtained with NCBI BLAST and RefSeq entries. When identical proteins are present, the self-match may not be listed first in BLASTP output. In such cases, the table above has been reordered to place it first.
See About the Figures for the scoring system used in the figure above right. The same scoring system was used in the table of BLASTP results.
Guide to the Human Genome
Copyright © 2010 by Stewart Scherer. All rights reserved.
