
| Name: TP53INP2 | Sequence: fasta or formatted (220aa) | NCBI GI: 39930399 | |
|
Description: tumor protein p53 inducible nuclear protein 2
|
Referenced in:
| ||
|
Composition:
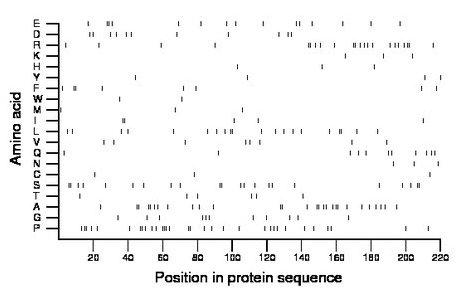
Amino acid Percentage Count Longest homopolymer A alanine 12.7 28 2 C cysteine 1.4 3 1 D aspartate 5.0 11 1 E glutamate 6.8 15 2 F phenylalanine 3.6 8 2 G glycine 5.0 11 1 H histidine 1.4 3 1 I isoleucine 2.3 5 2 K lysine 1.4 3 1 L leucine 9.1 20 2 M methionine 1.4 3 1 N asparagine 1.4 3 1 P proline 14.5 32 3 Q glutamine 5.0 11 1 R arginine 10.0 22 2 S serine 10.0 22 2 T threonine 2.7 6 1 V valine 3.6 8 1 W tryptophan 0.9 2 1 Y tyrosine 1.8 4 1 |
Comparative genomics:
Search single species RefSeq proteins at NCBI
Search summary 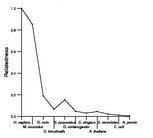
Figure data | ||
Related human proteins:Protein Relative score Description Self-match 1.000 tumor protein p53 inducible nuclear protein 2 TP53INP1 0.189 tumor protein p53 inducible nuclear protein 1 isofor... TP53INP1 0.099 tumor protein p53 inducible nuclear protein 1 isofo... LOC100292482 0.054 PREDICTED: hypothetical protein LOC100287907 0.052 PREDICTED: hypothetical protein LOC100287907 0.052 PREDICTED: hypothetical protein XP_002343168 IRS2 0.045 insulin receptor substrate 2 LMTK3 0.040 lemur tyrosine kinase 3 USP42 0.038 ubiquitin specific peptidase 42 USP31 0.038 ubiquitin specific peptidase 31 SPEG 0.035 SPEG complex locus HCN2 0.035 hyperpolarization activated cyclic nucleotide-gated... LOC284297 0.035 hypothetical protein LOC284297 DIAPH1 0.033 diaphanous 1 isoform 2 DIAPH1 0.033 diaphanous 1 isoform 1 ENAH 0.033 enabled homolog isoform a ENAH 0.033 enabled homolog isoform b WASL 0.033 Wiskott-Aldrich syndrome gene-like protein ATXN2 0.033 ataxin 2 ATN1 0.031 atrophin-1 ATN1 0.031 atrophin-1 THAP8 0.031 THAP domain containing 8 NACA 0.031 nascent polypeptide-associated complex alpha subuni... KIAA0754 0.031 hypothetical protein LOC643314 BAT2 0.031 HLA-B associated transcript-2 SRRM2 0.031 splicing coactivator subunit SRm300 MAP7D1 0.031 MAP7 domain containing 1 CROCC 0.028 ciliary rootlet coiled-coil ZNF598 0.028 zinc finger protein 598 MEX3C 0.028 ring finger and KH domain containing 2Human BLASTP results (used to prepare the table) | |||
Gene descriptions are from NCBI RefSeq. Search results were obtained with NCBI BLAST and RefSeq entries. When identical proteins are present, the self-match may not be listed first in BLASTP output. In such cases, the table above has been reordered to place it first.
See About the Figures for the scoring system used in the figure above right. The same scoring system was used in the table of BLASTP results.
Guide to the Human Genome
Copyright © 2010 by Stewart Scherer. All rights reserved.
