
| Name: FOXP3 | Sequence: fasta or formatted (431aa) | NCBI GI: 31982943 | |
|
Description: forkhead box P3 isoform a
|
Referenced in:
| ||
Other entries for this name:
alt prot [396aa] forkhead box P3 isoform b | |||
|
Composition:
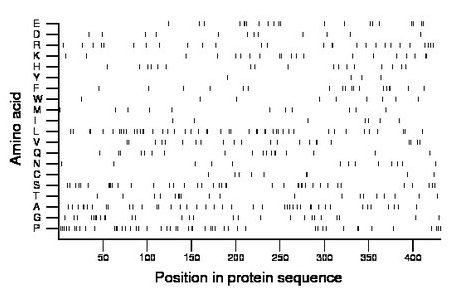
Amino acid Percentage Count Longest homopolymer A alanine 9.7 42 2 C cysteine 2.1 9 2 D aspartate 2.8 12 1 E glutamate 4.9 21 2 F phenylalanine 4.2 18 2 G glycine 6.3 27 2 H histidine 3.9 17 1 I isoleucine 1.6 7 1 K lysine 4.6 20 2 L leucine 10.9 47 2 M methionine 2.6 11 1 N asparagine 3.0 13 1 P proline 11.1 48 2 Q glutamine 4.2 18 2 R arginine 6.3 27 2 S serine 9.3 40 4 T threonine 4.4 19 2 V valine 5.1 22 2 W tryptophan 2.1 9 1 Y tyrosine 0.9 4 1 |
Comparative genomics:
Search single species RefSeq proteins at NCBI
Search summary 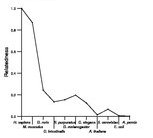
Figure data | ||
Related human proteins:Protein Relative score Description Self-match 1.000 forkhead box P3 isoform a FOXP3 0.897 forkhead box P3 isoform b FOXP1 0.237 forkhead box P1 isoform 1 FOXP2 0.225 forkhead box P2 isoform I FOXP2 0.225 forkhead box P2 isoform III FOXP2 0.225 forkhead box P2 isoform II FOXP4 0.224 forkhead box P4 isoform 2 FOXP4 0.222 forkhead box P4 isoform 3 FOXP4 0.222 forkhead box P4 isoform 1 FOXJ3 0.069 forkhead box J3 FOXJ2 0.068 forkhead box J2 FOXN3 0.066 checkpoint suppressor 1 isoform 1 FOXN3 0.066 checkpoint suppressor 1 isoform 2 FOXJ1 0.066 forkhead box J1 FOXC2 0.063 forkhead box C2 FOXE3 0.062 forkhead box E3 FOXL1 0.062 forkhead box L1 FOXC1 0.062 forkhead box C1 FOXI3 0.061 forkhead box I3 FOXE1 0.060 forkhead box E1 FOXG1 0.060 forkhead box G1 FOXD2 0.060 forkhead box D2 FOXL2 0.060 forkhead box L2 FOXA1 0.059 forkhead box A1 FOXK2 0.057 forkhead box K2 FOXF1 0.057 forkhead box F1 FOXI2 0.057 forkhead box I2 FOXA2 0.057 forkhead box A2 isoform 2 FOXI1 0.057 forkhead box I1 isoform a FOXA2 0.057 forkhead box A2 isoform 1Human BLASTP results (used to prepare the table) | |||
Gene descriptions are from NCBI RefSeq. Search results were obtained with NCBI BLAST and RefSeq entries. When identical proteins are present, the self-match may not be listed first in BLASTP output. In such cases, the table above has been reordered to place it first.
See About the Figures for the scoring system used in the figure above right. The same scoring system was used in the table of BLASTP results.
Guide to the Human Genome
Copyright © 2010 by Stewart Scherer. All rights reserved.
