
| Name: FOXP2 | Sequence: fasta or formatted (740aa) | NCBI GI: 149999352 | |
|
Description: forkhead box P2 isoform II
|
Referenced in: Protein Composition and Structure
| ||
Other entries for this name:
alt prot [715aa] forkhead box P2 isoform I alt prot [623aa] forkhead box P2 isoform III | |||
|
Composition:
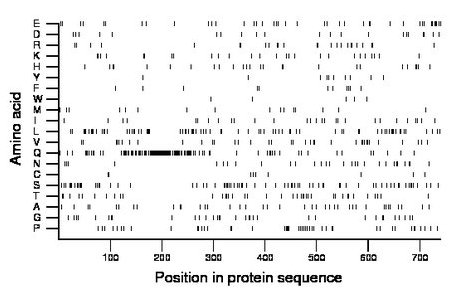
Amino acid Percentage Count Longest homopolymer A alanine 5.9 44 2 C cysteine 1.2 9 1 D aspartate 3.1 23 2 E glutamate 5.8 43 3 F phenylalanine 1.5 11 1 G glycine 4.5 33 2 H histidine 3.6 27 2 I isoleucine 3.8 28 1 K lysine 3.5 26 2 L leucine 10.1 75 3 M methionine 2.6 19 2 N asparagine 4.2 31 2 P proline 6.2 46 2 Q glutamine 17.2 127 40 R arginine 3.5 26 3 S serine 10.5 78 3 T threonine 5.7 42 2 V valine 5.0 37 2 W tryptophan 0.7 5 1 Y tyrosine 1.4 10 1 |
Comparative genomics:
Search single species RefSeq proteins at NCBI
Search summary 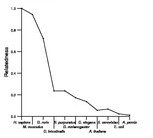
Figure data | ||
Related human proteins:Protein Relative score Description Self-match 1.000 forkhead box P2 isoform II FOXP2 0.951 forkhead box P2 isoform I FOXP2 0.844 forkhead box P2 isoform III FOXP1 0.558 forkhead box P1 isoform 1 FOXP4 0.473 forkhead box P4 isoform 1 FOXP4 0.466 forkhead box P4 isoform 2 FOXP4 0.457 forkhead box P4 isoform 3 FOXP3 0.136 forkhead box P3 isoform b FOXP3 0.136 forkhead box P3 isoform a MLL2 0.068 myeloid/lymphoid or mixed-lineage leukemia 2 MED12 0.067 mediator complex subunit 12 ZNF853 0.066 zinc finger protein 853 MAML2 0.065 mastermind-like 2 MED15 0.060 mediator complex subunit 15 isoform a MED15 0.060 mediator complex subunit 15 isoform b PAXIP1 0.048 PAX interacting protein 1 TOX3 0.048 TOX high mobility group box family member 3 isoform... TOX3 0.048 TOX high mobility group box family member 3 isoform... FOXJ1 0.046 forkhead box J1 TBP 0.044 TATA box binding protein FOXJ3 0.044 forkhead box J3 FOXA3 0.043 forkhead box A3 FOXK2 0.040 forkhead box K2 FOXC2 0.040 forkhead box C2 BMP2K 0.040 BMP-2 inducible kinase isoform a BMP2K 0.040 BMP-2 inducible kinase isoform b TCHH 0.040 trichohyalin FOXN2 0.039 T-cell leukemia virus enhancer factor FOXN3 0.038 checkpoint suppressor 1 isoform 1 FOXN3 0.038 checkpoint suppressor 1 isoform 2Human BLASTP results (used to prepare the table) | |||
Gene descriptions are from NCBI RefSeq. Search results were obtained with NCBI BLAST and RefSeq entries. When identical proteins are present, the self-match may not be listed first in BLASTP output. In such cases, the table above has been reordered to place it first.
See About the Figures for the scoring system used in the figure above right. The same scoring system was used in the table of BLASTP results.
Guide to the Human Genome
Copyright © 2010 by Stewart Scherer. All rights reserved.
