
| Name: FOXJ3 | Sequence: fasta or formatted (622aa) | NCBI GI: 50345831 | |
|
Description: forkhead box J3
|
Referenced in:
| ||
|
Composition:
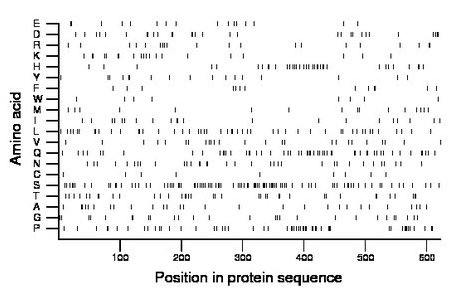
Amino acid Percentage Count Longest homopolymer A alanine 4.5 28 2 C cysteine 1.4 9 1 D aspartate 5.1 32 2 E glutamate 2.7 17 2 F phenylalanine 2.1 13 2 G glycine 4.3 27 1 H histidine 5.8 36 2 I isoleucine 3.4 21 2 K lysine 3.5 22 3 L leucine 7.9 49 2 M methionine 2.9 18 2 N asparagine 5.5 34 2 P proline 9.2 57 4 Q glutamine 9.3 58 3 R arginine 3.2 20 2 S serine 15.0 93 2 T threonine 6.1 38 2 V valine 4.0 25 1 W tryptophan 1.3 8 1 Y tyrosine 2.7 17 2 |
Comparative genomics:
Search single species RefSeq proteins at NCBI
Search summary 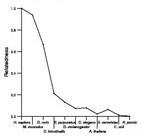
Figure data | ||
Related human proteins:Protein Relative score Description Self-match 1.000 forkhead box J3 FOXJ2 0.254 forkhead box J2 FOXC2 0.086 forkhead box C2 FOXI1 0.081 forkhead box I1 isoform a FOXG1 0.078 forkhead box G1 FOXI3 0.078 forkhead box I3 FOXI2 0.077 forkhead box I2 FOXJ1 0.077 forkhead box J1 FOXA2 0.074 forkhead box A2 isoform 2 FOXA2 0.074 forkhead box A2 isoform 1 FOXA3 0.074 forkhead box A3 FOXK2 0.073 forkhead box K2 FOXC1 0.073 forkhead box C1 FOXA1 0.073 forkhead box A1 FOXF1 0.072 forkhead box F1 FOXB1 0.071 forkhead box B1 FOXD2 0.070 forkhead box D2 FOXD1 0.070 forkhead box D1 FOXF2 0.070 forkhead box F2 FOXL1 0.070 forkhead box L1 FOXK1 0.070 forkhead box K1 FOXD3 0.069 forkhead box D3 FOXE1 0.068 forkhead box E1 FOXB2 0.066 forkhead box B2 FOXD4L1 0.065 forkhead box D4-like 1 FOXS1 0.065 forkhead box S1 FOXN2 0.065 T-cell leukemia virus enhancer factor FOXD4L3 0.064 forkhead box D4-like 3 FOXI1 0.064 forkhead box I1 isoform b FOXD4L2 0.064 forkhead box D4-like 2Human BLASTP results (used to prepare the table) | |||
Gene descriptions are from NCBI RefSeq. Search results were obtained with NCBI BLAST and RefSeq entries. When identical proteins are present, the self-match may not be listed first in BLASTP output. In such cases, the table above has been reordered to place it first.
See About the Figures for the scoring system used in the figure above right. The same scoring system was used in the table of BLASTP results.
Guide to the Human Genome
Copyright © 2010 by Stewart Scherer. All rights reserved.
