
| Name: TAX1BP3 | Sequence: fasta or formatted (124aa) | NCBI GI: 11993943 | |
|
Description: Tax1 binding protein 3
| Not currently referenced in the text | ||
|
Composition:
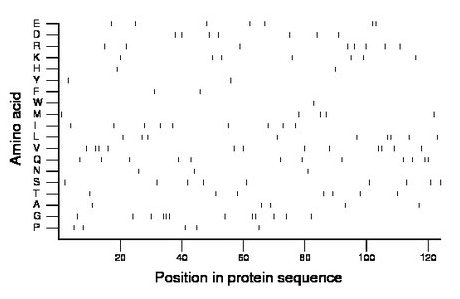
Amino acid Percentage Count Longest homopolymer A alanine 4.0 5 1 C cysteine 0.0 0 0 D aspartate 5.6 7 1 E glutamate 5.6 7 2 F phenylalanine 1.6 2 1 G glycine 9.7 12 3 H histidine 1.6 2 1 I isoleucine 7.3 9 1 K lysine 5.6 7 1 L leucine 7.3 9 2 M methionine 4.0 5 1 N asparagine 2.4 3 1 P proline 4.0 5 1 Q glutamine 9.7 12 2 R arginine 6.5 8 1 S serine 7.3 9 1 T threonine 5.6 7 1 V valine 9.7 12 2 W tryptophan 0.8 1 1 Y tyrosine 1.6 2 1 |
Comparative genomics:
Search single species RefSeq proteins at NCBI
Search summary 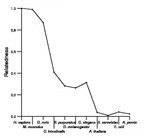
Figure data | ||
Related human proteins:Protein Relative score Description Self-match 1.000 Tax1 binding protein 3 SCRIB 0.164 scribble isoform b SCRIB 0.164 scribble isoform a ERBB2IP 0.155 ERBB2 interacting protein isoform 7 ERBB2IP 0.150 ERBB2 interacting protein isoform 2 LRRC7 0.145 leucine rich repeat containing 7 DLG2 0.141 chapsyn-110 isoform 3 DLG2 0.141 chapsyn-110 isoform 1 DLG2 0.141 chapsyn-110 isoform 2 DLG3 0.132 synapse-associated protein 102 isoform a SYNJ2BP 0.127 synaptojanin 2 binding protein DLG1 0.127 discs, large homolog 1 isoform 1 DLG1 0.127 discs, large homolog 1 isoform 2 PDZRN3 0.123 PDZ domain containing ring finger 3 DLG4 0.118 post-synaptic density protein 95 isoform 1 DLG4 0.118 post-synaptic density protein 95 isoform 2 PDZD7 0.114 PDZ domain containing 7 SLC9A3R2 0.114 solute carrier family 9 isoform 3 regulator 2 isofo... SLC9A3R2 0.114 solute carrier family 9 isoform 3 regulator 2 isofor... DLG3 0.109 synapse-associated protein 102 isoform b DFNB31 0.105 CASK-interacting protein CIP98 isoform 1 SLC9A3R1 0.100 sodium/hydrogen exchanger regulatory factor 1 USH1C 0.095 harmonin isoform b3 USH1C 0.095 harmonin isoform a IL16 0.091 interleukin 16 isoform 2 MAGI1 0.086 membrane associated guanylate kinase, WW and PDZ dom... MAGI1 0.086 membrane associated guanylate kinase, WW and PDZ dom... FRMPD2 0.086 FERM and PDZ domain containing 2 isoform 1 FRMPD2 0.086 FERM and PDZ domain containing 2 isoform 3 SDCBP 0.086 syntenin isoform 3Human BLASTP results (used to prepare the table) | |||
Gene descriptions are from NCBI RefSeq. Search results were obtained with NCBI BLAST and RefSeq entries. When identical proteins are present, the self-match may not be listed first in BLASTP output. In such cases, the table above has been reordered to place it first.
See About the Figures for the scoring system used in the figure above right. The same scoring system was used in the table of BLASTP results.
Guide to the Human Genome
Copyright © 2010 by Stewart Scherer. All rights reserved.
