
| Name: LOC100134017 | Sequence: fasta or formatted (229aa) | NCBI GI: 239754748 | |
|
Description: PREDICTED: hypothetical protein
| Not currently referenced in the text | ||
|
Composition:
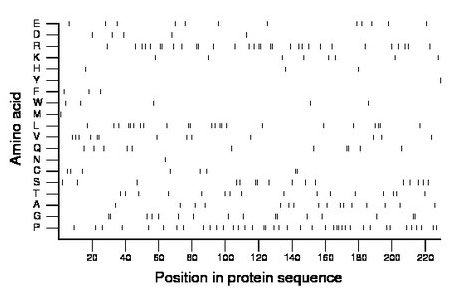
Amino acid Percentage Count Longest homopolymer A alanine 7.0 16 1 C cysteine 3.5 8 2 D aspartate 2.2 5 1 E glutamate 5.2 12 1 F phenylalanine 1.3 3 1 G glycine 7.0 16 2 H histidine 1.3 3 1 I isoleucine 0.0 0 0 K lysine 3.5 8 1 L leucine 10.0 23 2 M methionine 0.4 1 1 N asparagine 0.4 1 1 P proline 17.5 40 2 Q glutamine 4.8 11 2 R arginine 13.5 31 2 S serine 7.0 16 2 T threonine 7.0 16 1 V valine 5.7 13 2 W tryptophan 2.2 5 1 Y tyrosine 0.4 1 1 |
Comparative genomics:
Search single species RefSeq proteins at NCBI
Search summary 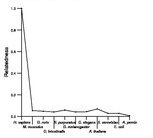
Figure data | ||
Related human proteins:Protein Relative score Description Self-match 1.000 PREDICTED: hypothetical protein PRG4 0.056 proteoglycan 4 isoform D PRG4 0.056 proteoglycan 4 isoform C PRG4 0.056 proteoglycan 4 isoform B PRG4 0.056 proteoglycan 4 isoform A GLTSCR1 0.052 glioma tumor suppressor candidate region gene 1 [Ho... MAPT 0.050 microtubule-associated protein tau isoform 6 MUC2 0.050 mucin 2 precursor MBD6 0.045 methyl-CpG binding domain protein 6 SYNJ1 0.041 synaptojanin 1 isoform a SYNJ1 0.041 synaptojanin 1 isoform b C2orf55 0.041 hypothetical protein LOC343990 C17orf96 0.041 hypothetical protein LOC100170841 CCNI2 0.041 cyclin I family, member 2 TNRC18 0.041 trinucleotide repeat containing 18 B4GALNT4 0.039 beta 1,4-N-acetylgalactosaminyltransferase-transfera... GAS2L1 0.039 growth arrest-specific 2 like 1 isoform a GAS2L1 0.039 growth arrest-specific 2 like 1 isoform a NACA 0.039 nascent polypeptide-associated complex alpha subuni... TTBK1 0.039 tau tubulin kinase 1 SYNPO2L 0.039 synaptopodin 2-like isoform a SYNPO2L 0.039 synaptopodin 2-like isoform b GGN 0.039 gametogenetin LOC390595 0.037 PREDICTED: similar to ubiquitin-associated protein ... LOC390595 0.037 PREDICTED: similar to ubiquitin-associated protein ... LOC390595 0.037 PREDICTED: hypothetical protein SRRM2 0.037 splicing coactivator subunit SRm300 KPRP 0.037 keratinocyte proline-rich protein LOC100134147 0.037 PREDICTED: hypothetical protein LOC100290265 0.037 PREDICTED: hypothetical protein XP_002346787Human BLASTP results (used to prepare the table) | |||
Gene descriptions are from NCBI RefSeq. Search results were obtained with NCBI BLAST and RefSeq entries. When identical proteins are present, the self-match may not be listed first in BLASTP output. In such cases, the table above has been reordered to place it first.
See About the Figures for the scoring system used in the figure above right. The same scoring system was used in the table of BLASTP results.
Guide to the Human Genome
Copyright © 2010 by Stewart Scherer. All rights reserved.
