
| Name: CDH12 | Sequence: fasta or formatted (794aa) | NCBI GI: 16445393 | |
|
Description: cadherin 12, type 2 preproprotein
|
Referenced in: Cadherins and Related Proteins
| ||
|
Composition:
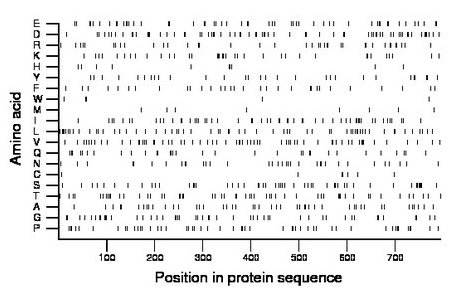
Amino acid Percentage Count Longest homopolymer A alanine 5.9 47 2 C cysteine 0.9 7 1 D aspartate 8.4 67 2 E glutamate 6.7 53 3 F phenylalanine 4.0 32 2 G glycine 6.4 51 3 H histidine 1.3 10 1 I isoleucine 7.1 56 2 K lysine 4.7 37 3 L leucine 8.2 65 3 M methionine 1.1 9 1 N asparagine 4.3 34 2 P proline 6.4 51 2 Q glutamine 4.3 34 2 R arginine 4.9 39 2 S serine 6.4 51 2 T threonine 6.9 55 2 V valine 7.8 62 2 W tryptophan 0.6 5 1 Y tyrosine 3.7 29 1 |
Comparative genomics:
Search single species RefSeq proteins at NCBI
Search summary 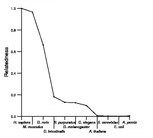
Figure data | ||
Related human proteins:Protein Relative score Description Self-match 1.000 cadherin 12, type 2 preproprotein CDH10 0.614 cadherin 10, type 2 preproprotein CDH6 0.613 cadherin 6, type 2 preproprotein CDH9 0.589 cadherin 9, type 2 preproprotein CDH18 0.582 cadherin 18, type 2 preproprotein CDH7 0.575 cadherin 7, type 2 preproprotein CDH7 0.575 cadherin 7, type 2 preproprotein CDH11 0.553 cadherin 11, type 2 preproprotein CDH8 0.549 cadherin 8, type 2 preproprotein CDH20 0.547 cadherin 20, type 2 preproprotein CDH22 0.485 cadherin 22 precursor CDH24 0.448 cadherin-like 24 isoform 2 CDH24 0.437 cadherin-like 24 isoform 1 CDH19 0.425 cadherin 19, type 2 preproprotein CDH5 0.302 cadherin 5, type 2 preproprotein CDH4 0.251 cadherin 4, type 1 preproprotein CDH2 0.251 cadherin 2, type 1 preproprotein CDH15 0.223 cadherin 15 preproprotein CDH1 0.220 cadherin 1, type 1 preproprotein CDH3 0.202 cadherin 3, type 1 preproprotein DSC1 0.140 desmocollin 1 isoform Dsc1b preproprotein DSC1 0.140 desmocollin 1 isoform Dsc1a preproprotein CDH13 0.132 cadherin 13 preproprotein FAT1 0.130 FAT tumor suppressor 1 precursor DSC2 0.121 desmocollin 2 isoform Dsc2b preproprotein DSC2 0.121 desmocollin 2 isoform Dsc2a preproprotein DSC3 0.119 desmocollin 3 isoform Dsc3b preproprotein DSC3 0.119 desmocollin 3 isoform Dsc3a preproprotein FAT4 0.119 FAT tumor suppressor homolog 4 CELSR2 0.116 cadherin EGF LAG seven-pass G-type receptor 2Human BLASTP results (used to prepare the table) | |||
Gene descriptions are from NCBI RefSeq. Search results were obtained with NCBI BLAST and RefSeq entries. When identical proteins are present, the self-match may not be listed first in BLASTP output. In such cases, the table above has been reordered to place it first.
See About the Figures for the scoring system used in the figure above right. The same scoring system was used in the table of BLASTP results.
Guide to the Human Genome
Copyright © 2010 by Stewart Scherer. All rights reserved.
