
| Name: PTCRA | Sequence: fasta or formatted (281aa) | NCBI GI: 110227624 | |
|
Description: pre T-cell antigen receptor alpha
|
Referenced in:
| ||
|
Composition:
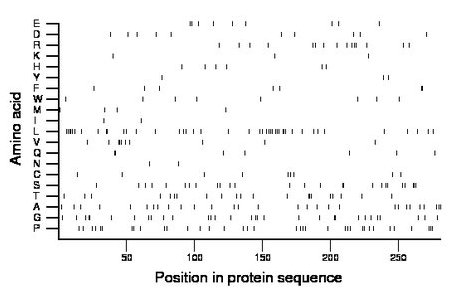
Amino acid Percentage Count Longest homopolymer A alanine 10.3 29 2 C cysteine 3.2 9 1 D aspartate 3.6 10 1 E glutamate 3.2 9 2 F phenylalanine 2.5 7 2 G glycine 11.0 31 2 H histidine 2.1 6 1 I isoleucine 0.7 2 1 K lysine 1.1 3 1 L leucine 15.3 43 5 M methionine 1.4 4 1 N asparagine 0.7 2 1 P proline 12.8 36 3 Q glutamine 2.5 7 2 R arginine 5.3 15 2 S serine 9.3 26 3 T threonine 7.5 21 3 V valine 3.6 10 3 W tryptophan 2.8 8 1 Y tyrosine 1.1 3 1 |
Comparative genomics:
Search single species RefSeq proteins at NCBI
Search summary 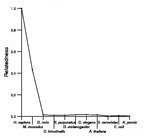
Figure data | ||
Related human proteins:Protein Relative score Description Self-match 1.000 pre T-cell antigen receptor alpha CTNND2 0.023 catenin (cadherin-associated protein), delta 2 (neur... LOC100129463 0.018 PREDICTED: hypothetical protein MEX3B 0.018 mex-3 homolog B LOC100132247 0.014 hypothetical protein LOC100132247 LOC728888 0.014 PREDICTED: similar to acyl-CoA synthetase medium-ch... TNRC6C 0.014 trinucleotide repeat containing 6C isoform 1 BIRC6 0.014 baculoviral IAP repeat-containing 6 NPIPL3 0.014 nuclear pore complex interacting protein-like 3 [Ho... ATN1 0.014 atrophin-1 ATN1 0.014 atrophin-1 C1orf127 0.014 hypothetical protein LOC148345 LOC728449 0.014 PREDICTED: hypothetical protein LOC100290359 0.012 PREDICTED: hypothetical protein XP_002346414 LOC100287202 0.012 PREDICTED: hypothetical protein XP_002342114 HEPACAM 0.012 hepatocyte cell adhesion molecule PAX8 0.012 paired box 8 isoform PAX8B ARHGAP17 0.012 nadrin isoform 1 ARHGAP17 0.012 nadrin isoform 2 OBSCN 0.012 obscurin, cytoskeletal calmodulin and titin-interac... LOC100133889 0.012 PREDICTED: hypothetical protein LOC100132646 0.012 PREDICTED: hypothetical protein LOC730456 0.012 PREDICTED: hypothetical protein HCN4 0.011 hyperpolarization activated cyclic nucleotide-gated p... LOC100292745 0.011 PREDICTED: hypothetical protein LOC100290074 0.011 PREDICTED: hypothetical protein XP_002346855 LOC100287034 0.011 PREDICTED: hypothetical protein XP_002342693 NEUROD2 0.011 neurogenic differentiation 2 RTN4RL2 0.011 reticulon 4 receptor-like 2 SRRM1 0.011 serine/arginine repetitive matrix 1Human BLASTP results (used to prepare the table) | |||
Gene descriptions are from NCBI RefSeq. Search results were obtained with NCBI BLAST and RefSeq entries. When identical proteins are present, the self-match may not be listed first in BLASTP output. In such cases, the table above has been reordered to place it first.
See About the Figures for the scoring system used in the figure above right. The same scoring system was used in the table of BLASTP results.
Guide to the Human Genome
Copyright © 2010 by Stewart Scherer. All rights reserved.
