
| Name: SMCR8 | Sequence: fasta or formatted (937aa) | NCBI GI: 146260268 | |
|
Description: Smith-Magenis syndrome chromosome region, candidate 8
| Not currently referenced in the text | ||
|
Composition:
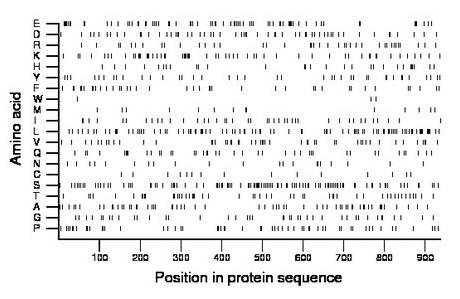
Amino acid Percentage Count Longest homopolymer A alanine 6.3 59 1 C cysteine 1.7 16 2 D aspartate 6.1 57 2 E glutamate 8.0 75 3 F phenylalanine 4.2 39 1 G glycine 4.4 41 1 H histidine 3.2 30 2 I isoleucine 4.6 43 2 K lysine 6.2 58 2 L leucine 9.9 93 2 M methionine 1.6 15 1 N asparagine 2.2 21 1 P proline 6.0 56 2 Q glutamine 4.5 42 2 R arginine 4.2 39 1 S serine 11.6 109 3 T threonine 5.3 50 2 V valine 5.5 52 2 W tryptophan 0.3 3 1 Y tyrosine 4.2 39 2 |
Comparative genomics:
Search single species RefSeq proteins at NCBI
Search summary 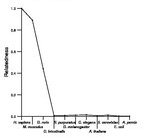
Figure data | ||
Related human proteins:Protein Relative score Description Self-match 1.000 Smith-Magenis syndrome chromosome region, candidate... FKBP15 0.014 FK506 binding protein 15, 133kDa GOLGB1 0.011 golgi autoantigen, golgin subfamily b, macrogolgin ... MAGEC1 0.010 melanoma antigen family C, 1 MLL3 0.009 myeloid/lymphoid or mixed-lineage leukemia 3 MAP3K9 0.008 mitogen-activated protein kinase kinase kinase 9 [Ho... RSF1 0.006 remodeling and spacing factor 1 EDC4 0.005 autoantigen RCD8 DSPP 0.005 dentin sialophosphoprotein preproprotein CROCC 0.005 ciliary rootlet coiled-coil PCLO 0.005 piccolo isoform 2 PCLO 0.005 piccolo isoform 1 GPRIN3 0.005 G protein-regulated inducer of neurite outgrowth 3 ... SMTNL1 0.005 smoothelin-like 1 PNN 0.005 pinin, desmosome associated protein AFF1 0.004 myeloid/lymphoid or mixed-lineage leukemia trithorax ... MUC17 0.004 mucin 17 ATF7IP 0.004 activating transcription factor 7 interacting protei... PHLDB1 0.004 pleckstrin homology-like domain, family B, member 1... PHLDB1 0.004 pleckstrin homology-like domain, family B, member 1... PHLDB1 0.004 pleckstrin homology-like domain, family B, member 1 ... F5 0.004 coagulation factor V precursor KIAA0947 0.004 hypothetical protein LOC23379 CLIP1 0.004 restin isoform b CLIP1 0.004 restin isoform a SORBS1 0.004 sorbin and SH3 domain containing 1 isoform 6 ANK1 0.004 ankyrin 1 isoform 1 ANK1 0.004 ankyrin 1 isoform 3 ANK1 0.004 ankyrin 1 isoform 2 ANK1 0.004 ankyrin 1 isoform 4Human BLASTP results (used to prepare the table) | |||
Gene descriptions are from NCBI RefSeq. Search results were obtained with NCBI BLAST and RefSeq entries. When identical proteins are present, the self-match may not be listed first in BLASTP output. In such cases, the table above has been reordered to place it first.
See About the Figures for the scoring system used in the figure above right. The same scoring system was used in the table of BLASTP results.
Guide to the Human Genome
Copyright © 2010 by Stewart Scherer. All rights reserved.
