
| Name: RSF1 | Sequence: fasta or formatted (1441aa) | NCBI GI: 38788333 | |
|
Description: remodeling and spacing factor 1
|
Referenced in:
| ||
|
Composition:

Amino acid Percentage Count Longest homopolymer A alanine 4.4 64 6 C cysteine 1.9 27 1 D aspartate 7.6 110 3 E glutamate 15.2 219 7 F phenylalanine 1.8 26 1 G glycine 4.2 60 3 H histidine 1.0 14 1 I isoleucine 4.4 63 2 K lysine 11.2 161 3 L leucine 7.0 101 2 M methionine 1.3 19 1 N asparagine 3.5 50 1 P proline 5.8 83 3 Q glutamine 3.3 48 2 R arginine 6.2 89 4 S serine 10.1 146 3 T threonine 5.1 73 2 V valine 4.1 59 2 W tryptophan 0.6 8 1 Y tyrosine 1.5 21 1 |
Comparative genomics:
Search single species RefSeq proteins at NCBI
Search summary 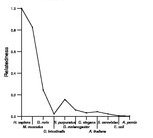
Figure data | ||
Related human proteins:Protein Relative score Description Self-match 1.000 remodeling and spacing factor 1 ATRX 0.036 transcriptional regulator ATRX isoform 2 ATRX 0.036 transcriptional regulator ATRX isoform 1 NEFH 0.033 neurofilament, heavy polypeptide 200kDa WDR87 0.027 NYD-SP11 protein ACIN1 0.027 apoptotic chromatin condensation inducer 1 TCHH 0.026 trichohyalin BOD1L 0.024 biorientation of chromosomes in cell division 1-like... MAP1B 0.022 microtubule-associated protein 1B ANKRD11 0.020 ankyrin repeat domain 11 HDGF2 0.020 hepatoma-derived growth factor-related protein 2 iso... HDGF2 0.020 hepatoma-derived growth factor-related protein 2 iso... RBBP6 0.020 retinoblastoma-binding protein 6 isoform 2 RBBP6 0.020 retinoblastoma-binding protein 6 isoform 1 CENPE 0.020 centromere protein E PCLO 0.020 piccolo isoform 2 PCLO 0.020 piccolo isoform 1 PRPF38B 0.018 PRP38 pre-mRNA processing factor 38 (yeast) domain ... KTN1 0.018 kinectin 1 isoform b MYH10 0.018 myosin, heavy polypeptide 10, non-muscle RBM25 0.018 RNA binding motif protein 25 CALD1 0.018 caldesmon 1 isoform 1 TRDN 0.018 triadin KTN1 0.017 kinectin 1 isoform a KTN1 0.017 kinectin 1 isoform a CENPF 0.017 centromere protein F MYST3 0.017 MYST histone acetyltransferase (monocytic leukemia)... MYST3 0.017 MYST histone acetyltransferase (monocytic leukemia)... MYST3 0.017 MYST histone acetyltransferase (monocytic leukemia)... MYH9 0.017 myosin, heavy polypeptide 9, non-muscleHuman BLASTP results (used to prepare the table) | |||
Gene descriptions are from NCBI RefSeq. Search results were obtained with NCBI BLAST and RefSeq entries. When identical proteins are present, the self-match may not be listed first in BLASTP output. In such cases, the table above has been reordered to place it first.
See About the Figures for the scoring system used in the figure above right. The same scoring system was used in the table of BLASTP results.
Guide to the Human Genome
Copyright © 2010 by Stewart Scherer. All rights reserved.
