
| Name: TOX4 | Sequence: fasta or formatted (621aa) | NCBI GI: 7662274 | |
|
Description: epidermal Langerhans cell protein LCP1
|
Referenced in: Nonhistone Chromosomal Proteins
| ||
|
Composition:
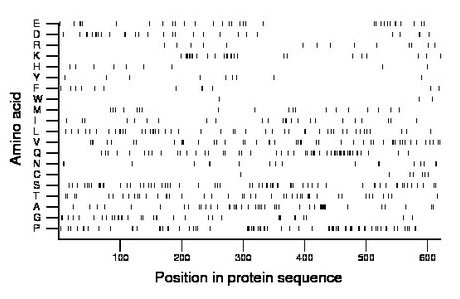
Amino acid Percentage Count Longest homopolymer A alanine 7.6 47 9 C cysteine 1.1 7 1 D aspartate 4.7 29 2 E glutamate 5.3 33 2 F phenylalanine 1.9 12 2 G glycine 5.8 36 3 H histidine 1.4 9 1 I isoleucine 3.9 24 2 K lysine 4.3 27 3 L leucine 7.6 47 2 M methionine 3.2 20 1 N asparagine 2.9 18 2 P proline 11.9 74 3 Q glutamine 8.4 52 3 R arginine 2.4 15 2 S serine 10.5 65 3 T threonine 7.4 46 2 V valine 7.7 48 3 W tryptophan 0.5 3 1 Y tyrosine 1.4 9 1 |
Comparative genomics:
Search single species RefSeq proteins at NCBI
Search summary 
Figure data | ||
Related human proteins:Protein Relative score Description Self-match 1.000 epidermal Langerhans cell protein LCP1 TOX3 0.263 TOX high mobility group box family member 3 isoform... TOX3 0.258 TOX high mobility group box family member 3 isoform... TOX 0.216 thymus high mobility group box protein TOX TOX2 0.165 TOX high mobility group box family member 2 isoform... TOX2 0.162 TOX high mobility group box family member 2 isoform... TOX2 0.162 TOX high mobility group box family member 2 isoform ... TOX2 0.128 TOX high mobility group box family member 2 isoform... LOC645490 0.041 PREDICTED: similar to hCG1991922 LOC645490 0.041 PREDICTED: similar to hCG1991922 LOC645490 0.041 PREDICTED: similar to hCG1991922 SSRP1 0.040 structure specific recognition protein 1 HMGB1 0.040 high-mobility group box 1 HMGB2 0.039 high-mobility group box 2 HMGB2 0.039 high-mobility group box 2 HMGB2 0.039 high-mobility group box 2 LOC729595 0.038 PREDICTED: similar to high mobility group box 3 [Ho... LOC729595 0.038 PREDICTED: similar to high mobility group box 3 [Ho... LOC729595 0.038 PREDICTED: similar to high mobility group box 3 iso... LOC729595 0.038 PREDICTED: similar to high mobility group box 3 iso... SP100 0.037 nuclear antigen Sp100 isoform 2 HMGB3 0.036 high-mobility group box 3 HMGB1L1 0.036 high-mobility group box 1-like 1 HMG20B 0.035 high-mobility group 20B MUC2 0.034 mucin 2 precursor HMGB4 0.034 HMG2 like isoform 1 HMGB4 0.034 HMG2 like isoform 2 HMGXB4 0.033 high-mobility group protein 2-like 1 LOC646993 0.032 PREDICTED: similar to high mobility group box 3 [Ho... LOC646993 0.032 PREDICTED: similar to high mobility group box 3 [Ho...Human BLASTP results (used to prepare the table) | |||
Gene descriptions are from NCBI RefSeq. Search results were obtained with NCBI BLAST and RefSeq entries. When identical proteins are present, the self-match may not be listed first in BLASTP output. In such cases, the table above has been reordered to place it first.
See About the Figures for the scoring system used in the figure above right. The same scoring system was used in the table of BLASTP results.
Guide to the Human Genome
Copyright © 2010 by Stewart Scherer. All rights reserved.
