
| Name: PRRT3 | Sequence: fasta or formatted (981aa) | NCBI GI: 136255216 | |
|
Description: proline-rich transmembrane protein 3
| Not currently referenced in the text | ||
|
Composition:
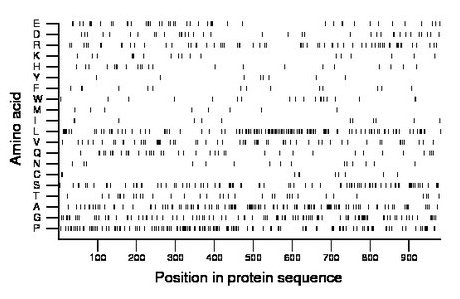
Amino acid Percentage Count Longest homopolymer A alanine 12.3 121 5 C cysteine 1.0 10 1 D aspartate 3.8 37 2 E glutamate 4.7 46 2 F phenylalanine 1.4 14 1 G glycine 9.9 97 2 H histidine 2.2 22 1 I isoleucine 1.2 12 1 K lysine 1.8 18 1 L leucine 12.8 126 6 M methionine 0.9 9 1 N asparagine 1.6 16 2 P proline 13.9 136 4 Q glutamine 4.1 40 2 R arginine 6.7 66 3 S serine 9.1 89 2 T threonine 3.6 35 2 V valine 6.0 59 2 W tryptophan 2.0 20 2 Y tyrosine 0.8 8 1 |
Comparative genomics:
Search single species RefSeq proteins at NCBI
Search summary 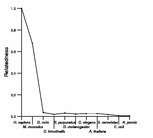
Figure data | ||
Related human proteins:Protein Relative score Description Self-match 1.000 proline-rich transmembrane protein 3 LOC401399 0.058 hypothetical protein LOC401399 KIAA0754 0.027 hypothetical protein LOC643314 NACA 0.024 nascent polypeptide-associated complex alpha subuni... GLTSCR1 0.023 glioma tumor suppressor candidate region gene 1 [Ho... PRB2 0.021 proline-rich protein BstNI subfamily 2 WDR33 0.021 WD repeat domain 33 isoform 1 SFPQ 0.020 splicing factor proline/glutamine rich (polypyrimidin... FSCB 0.020 fibrous sheath CABYR binding protein KIAA1522 0.020 hypothetical protein LOC57648 TTN 0.019 titin isoform N2-A WIPF1 0.019 WAS/WASL interacting protein family, member 1 [Homo... WIPF1 0.019 WAS/WASL interacting protein family, member 1 MLL2 0.019 myeloid/lymphoid or mixed-lineage leukemia 2 FLJ22184 0.019 PREDICTED: hypothetical protein FLJ22184 SEC24C 0.018 SEC24-related protein C SEC24C 0.018 SEC24-related protein C SHANK1 0.018 SH3 and multiple ankyrin repeat domains 1 NEFH 0.018 neurofilament, heavy polypeptide 200kDa ARHGAP17 0.018 nadrin isoform 1 TAF4 0.017 TBP-associated factor 4 FLJ22184 0.017 PREDICTED: hypothetical protein LOC80164 FLJ22184 0.017 PREDICTED: hypothetical protein FLJ22184 SYNPO 0.017 synaptopodin isoform A ZNF828 0.017 zinc finger protein 828 PCLO 0.017 piccolo isoform 2 PCLO 0.017 piccolo isoform 1 CASKIN2 0.017 cask-interacting protein 2 isoform b CASKIN2 0.017 cask-interacting protein 2 isoform a RERE 0.017 atrophin-1 like protein isoform bHuman BLASTP results (used to prepare the table) | |||
Gene descriptions are from NCBI RefSeq. Search results were obtained with NCBI BLAST and RefSeq entries. When identical proteins are present, the self-match may not be listed first in BLASTP output. In such cases, the table above has been reordered to place it first.
See About the Figures for the scoring system used in the figure above right. The same scoring system was used in the table of BLASTP results.
Guide to the Human Genome
Copyright © 2010 by Stewart Scherer. All rights reserved.
