
| Name: TFDP2 | Sequence: fasta or formatted (386aa) | NCBI GI: 5454112 | |
|
Description: transcription factor Dp-2 (E2F dimerization partner 2)
|
Referenced in:
| ||
|
Composition:
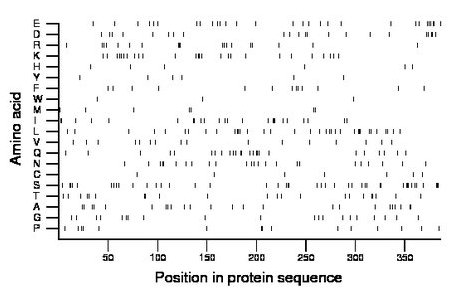
Amino acid Percentage Count Longest homopolymer A alanine 6.2 24 2 C cysteine 1.8 7 1 D aspartate 5.7 22 2 E glutamate 7.5 29 2 F phenylalanine 3.4 13 1 G glycine 5.2 20 1 H histidine 1.6 6 1 I isoleucine 6.2 24 3 K lysine 6.7 26 2 L leucine 9.1 35 3 M methionine 1.8 7 1 N asparagine 6.2 24 2 P proline 3.9 15 2 Q glutamine 6.5 25 2 R arginine 4.9 19 3 S serine 11.1 43 3 T threonine 5.7 22 2 V valine 4.1 16 1 W tryptophan 0.8 3 1 Y tyrosine 1.6 6 1 |
Comparative genomics:
Search single species RefSeq proteins at NCBI
Search summary 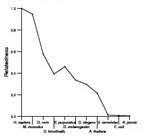
Figure data | ||
Related human proteins:Protein Relative score Description Self-match 1.000 transcription factor Dp-2 (E2F dimerization partner 2... TFDP1 0.558 transcription factor Dp-1 TFDP3 0.413 transcription factor Dp family, member 3 E2F4 0.024 E2F transcription factor 4 E2F5 0.019 E2F transcription factor 5 isoform 2 E2F5 0.019 E2F transcription factor 5 isoform 1 E2F3 0.016 E2F transcription factor 3 E2F1 0.012 E2F transcription factor 1 IVL 0.012 involucrin E2F7 0.012 E2F transcription factor 7 MYH11 0.012 smooth muscle myosin heavy chain 11 isoform SM1A [Ho... MYH11 0.012 smooth muscle myosin heavy chain 11 isoform SM1B [Ho... MYH11 0.012 smooth muscle myosin heavy chain 11 isoform SM2B [Ho... MYH11 0.012 smooth muscle myosin heavy chain 11 isoform SM2A [Ho... SMC1A 0.011 structural maintenance of chromosomes 1A MAP7D2 0.011 MAP7 domain containing 2 E2F8 0.011 E2F family member 8 CEP350 0.011 centrosome-associated protein 350 CCDC19 0.011 nasopharyngeal epithelium specific protein 1 GCOM1 0.009 GRINL1A combined protein isoform 2 GCOM1 0.009 GRINL1A combined protein isoform 1 GCOM1 0.009 GRINL1A combined protein isoform 8 GCOM1 0.009 GRINL1A upstream protein isoform 7 E2F2 0.009 E2F transcription factor 2 E2F6 0.009 E2F transcription factor 6 MNS1 0.009 meiosis-specific nuclear structural 1 ESF1 0.009 ABT1-associated protein BRD2 0.009 bromodomain containing 2 BRD2 0.009 bromodomain containing 2 HAP1 0.009 huntingtin-associated protein 1 isoform 3Human BLASTP results (used to prepare the table) | |||
Gene descriptions are from NCBI RefSeq. Search results were obtained with NCBI BLAST and RefSeq entries. When identical proteins are present, the self-match may not be listed first in BLASTP output. In such cases, the table above has been reordered to place it first.
See About the Figures for the scoring system used in the figure above right. The same scoring system was used in the table of BLASTP results.
Guide to the Human Genome
Copyright © 2010 by Stewart Scherer. All rights reserved.
