
| Name: HP1BP3 | Sequence: fasta or formatted (553aa) | NCBI GI: 56676330 | |
|
Description: HP1-BP74
| Not currently referenced in the text | ||
|
Composition:
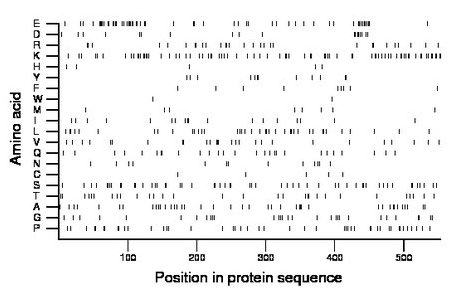
Amino acid Percentage Count Longest homopolymer A alanine 7.6 42 2 C cysteine 0.9 5 1 D aspartate 3.3 18 2 E glutamate 9.9 55 3 F phenylalanine 1.6 9 1 G glycine 5.6 31 2 H histidine 0.9 5 1 I isoleucine 3.3 18 2 K lysine 14.3 79 2 L leucine 7.2 40 2 M methionine 1.6 9 1 N asparagine 2.4 13 1 P proline 8.5 47 3 Q glutamine 4.9 27 1 R arginine 5.2 29 2 S serine 9.9 55 2 T threonine 5.4 30 2 V valine 4.9 27 3 W tryptophan 0.4 2 1 Y tyrosine 2.2 12 2 |
Comparative genomics:
Search single species RefSeq proteins at NCBI
Search summary 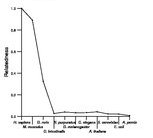
Figure data | ||
Related human proteins:Protein Relative score Description Self-match 1.000 HP1-BP74 H1FOO 0.038 H1 histone family, member O, oocyte-specific NEFH 0.037 neurofilament, heavy polypeptide 200kDa MAP1B 0.031 microtubule-associated protein 1B H1F0 0.027 H1 histone family, member 0 TRDN 0.027 triadin MYT1 0.027 myelin transcription factor 1 NEFM 0.025 neurofilament, medium polypeptide 150kDa isoform 1 ... NEFM 0.025 neurofilament, medium polypeptide 150kDa isoform 2 ... CDC2L2 0.023 cell division cycle 2-like 2 isoform 4 CDC2L2 0.023 cell division cycle 2-like 2 isoform 1 CDC2L1 0.023 cell division cycle 2-like 1 (PITSLRE proteins) isof... CDC2L1 0.023 cell division cycle 2-like 1 (PITSLRE proteins) isof... CDC2L1 0.023 cell division cycle 2-like 1 (PITSLRE proteins) isof... CDC2L1 0.023 cell division cycle 2-like 1 (PITSLRE proteins) isof... CDC2L1 0.023 cell division cycle 2-like 1 (PITSLRE proteins) isof... HIST1H1T 0.023 histone cluster 1, H1t NPM1 0.023 nucleophosmin 1 isoform 1 HIST1H1E 0.023 histone cluster 1, H1e HIST1H1C 0.023 histone cluster 1, H1c HIST1H1D 0.023 histone cluster 1, H1d HIST1H1B 0.023 histone cluster 1, H1b NCL 0.023 nucleolin DEK 0.023 DEK oncogene isoform 2 DEK 0.023 DEK oncogene isoform 1 YTHDC1 0.022 splicing factor YT521-B isoform 2 YTHDC1 0.022 splicing factor YT521-B isoform 1 NPM1 0.022 nucleophosmin 1 isoform 3 PNMAL1 0.022 PNMA-like 1 isoform a MLLT1 0.021 myeloid/lymphoid or mixed-lineage leukemia (trithora...Human BLASTP results (used to prepare the table) | |||
Gene descriptions are from NCBI RefSeq. Search results were obtained with NCBI BLAST and RefSeq entries. When identical proteins are present, the self-match may not be listed first in BLASTP output. In such cases, the table above has been reordered to place it first.
See About the Figures for the scoring system used in the figure above right. The same scoring system was used in the table of BLASTP results.
Guide to the Human Genome
Copyright © 2010 by Stewart Scherer. All rights reserved.
