
| Name: H1FOO | Sequence: fasta or formatted (346aa) | NCBI GI: 24475863 | |
|
Description: H1 histone family, member O, oocyte-specific
|
Referenced in: Histones, Related Proteins, and Modifying Enzymes
| ||
|
Composition:
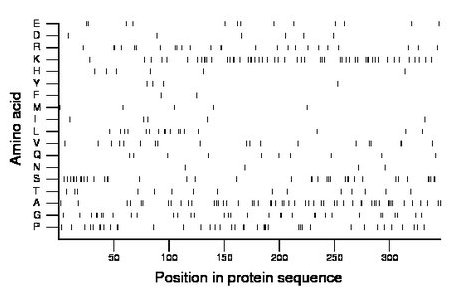
Amino acid Percentage Count Longest homopolymer A alanine 15.0 52 3 C cysteine 0.0 0 0 D aspartate 1.7 6 1 E glutamate 3.8 13 1 F phenylalanine 0.6 2 1 G glycine 9.5 33 2 H histidine 1.7 6 1 I isoleucine 1.4 5 1 K lysine 15.3 53 3 L leucine 4.9 17 2 M methionine 1.4 5 1 N asparagine 1.2 4 1 P proline 11.3 39 3 Q glutamine 2.9 10 1 R arginine 7.2 25 2 S serine 11.0 38 3 T threonine 4.3 15 1 V valine 5.5 19 2 W tryptophan 0.0 0 0 Y tyrosine 1.2 4 1 |
Comparative genomics:
Search single species RefSeq proteins at NCBI
Search summary 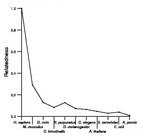
Figure data | ||
Related human proteins:Protein Relative score Description Self-match 1.000 H1 histone family, member O, oocyte-specific HIST1H1B 0.071 histone cluster 1, H1b HIST1H1E 0.069 histone cluster 1, H1e NEFH 0.069 neurofilament, heavy polypeptide 200kDa HIST1H1C 0.066 histone cluster 1, H1c HP1BP3 0.063 HP1-BP74 HIST1H1D 0.063 histone cluster 1, H1d H1FX 0.051 H1 histone family, member X PRB2 0.049 proline-rich protein BstNI subfamily 2 H1F0 0.046 H1 histone family, member 0 PRB1 0.046 proline-rich protein BstNI subfamily 1 isoform 1 pre... HIST1H1A 0.044 histone cluster 1, H1a SCAF1 0.044 SR-related CTD-associated factor 1 NOLC1 0.043 nucleolar and coiled-body phosphoprotein 1 SCARF2 0.041 scavenger receptor class F, member 2 isoform 1 [Homo... SCARF2 0.041 scavenger receptor class F, member 2 isoform 2 [Homo... SRRM2 0.041 splicing coactivator subunit SRm300 LOC100292370 0.040 PREDICTED: hypothetical protein MLLT1 0.040 myeloid/lymphoid or mixed-lineage leukemia (trithora... LOC100292035 0.040 PREDICTED: hypothetical protein XP_002345623 MAP4 0.038 microtubule-associated protein 4 isoform 5 MAP4 0.038 microtubule-associated protein 4 isoform 2 TRDN 0.038 triadin SYNJ1 0.038 synaptojanin 1 isoform c PRB4 0.038 proline-rich protein BstNI subfamily 4 precursor [Ho... BASP1 0.037 brain abundant, membrane attached signal protein 1 [... SYNJ1 0.037 synaptojanin 1 isoform d TNRC18 0.037 trinucleotide repeat containing 18 HIST1H1T 0.037 histone cluster 1, H1t FHDC1 0.035 FH2 domain containing 1Human BLASTP results (used to prepare the table) | |||
Gene descriptions are from NCBI RefSeq. Search results were obtained with NCBI BLAST and RefSeq entries. When identical proteins are present, the self-match may not be listed first in BLASTP output. In such cases, the table above has been reordered to place it first.
See About the Figures for the scoring system used in the figure above right. The same scoring system was used in the table of BLASTP results.
Guide to the Human Genome
Copyright © 2010 by Stewart Scherer. All rights reserved.
