
| Name: HIST1H1E | Sequence: fasta or formatted (219aa) | NCBI GI: 4885379 | |
|
Description: histone cluster 1, H1e
|
Referenced in: Histones, Related Proteins, and Modifying Enzymes
| ||
|
Composition:
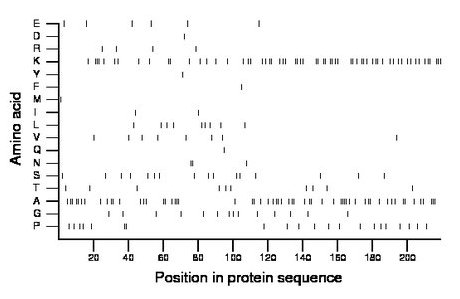
Amino acid Percentage Count Longest homopolymer A alanine 26.9 59 4 C cysteine 0.0 0 0 D aspartate 0.5 1 1 E glutamate 2.7 6 1 F phenylalanine 0.5 1 1 G glycine 6.4 14 1 H histidine 0.0 0 0 I isoleucine 0.9 2 1 K lysine 28.3 62 3 L leucine 4.1 9 1 M methionine 0.5 1 1 N asparagine 1.4 3 2 P proline 9.6 21 2 Q glutamine 0.5 1 1 R arginine 1.8 4 1 S serine 7.3 16 1 T threonine 4.6 10 1 V valine 3.7 8 1 W tryptophan 0.0 0 0 Y tyrosine 0.5 1 1 |
Comparative genomics:
Search single species RefSeq proteins at NCBI
Search summary 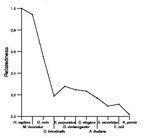
Figure data | ||
Related human proteins:Protein Relative score Description Self-match 1.000 histone cluster 1, H1e HIST1H1D 0.841 histone cluster 1, H1d HIST1H1C 0.812 histone cluster 1, H1c HIST1H1B 0.802 histone cluster 1, H1b HIST1H1A 0.632 histone cluster 1, H1a HIST1H1T 0.406 histone cluster 1, H1t H1F0 0.239 H1 histone family, member 0 H1FX 0.185 H1 histone family, member X NEFH 0.134 neurofilament, heavy polypeptide 200kDa H1FOO 0.111 H1 histone family, member O, oocyte-specific H1FNT 0.103 H1 histone family, member N, testis-specific SHPRH 0.082 SNF2 histone linker PHD RING helicase isoform a [Ho... SHPRH 0.082 SNF2 histone linker PHD RING helicase isoform b [Hom... LOC100292383 0.077 PREDICTED: hypothetical protein MAP7D1 0.077 MAP7 domain containing 1 BASP1 0.075 brain abundant, membrane attached signal protein 1 [... LOC100292062 0.072 PREDICTED: hypothetical protein XP_002346314 MARCKS 0.072 myristoylated alanine-rich protein kinase C substra... LOC100292370 0.072 PREDICTED: hypothetical protein LOC100293129 0.069 PREDICTED: hypothetical protein TRDN 0.069 triadin CDC2L5 0.069 cell division cycle 2-like 5 isoform 1 CDC2L5 0.069 cell division cycle 2-like 5 isoform 2 CHD6 0.069 chromodomain helicase DNA binding protein 6 AEBP1 0.069 adipocyte enhancer binding protein 1 precursor [Homo... MAP1B 0.069 microtubule-associated protein 1B CCDC71 0.064 coiled-coil domain containing 71 HP1BP3 0.062 HP1-BP74 LOC100287688 0.062 PREDICTED: hypothetical protein XP_002342270 TAF4 0.062 TBP-associated factor 4Human BLASTP results (used to prepare the table) | |||
Gene descriptions are from NCBI RefSeq. Search results were obtained with NCBI BLAST and RefSeq entries. When identical proteins are present, the self-match may not be listed first in BLASTP output. In such cases, the table above has been reordered to place it first.
See About the Figures for the scoring system used in the figure above right. The same scoring system was used in the table of BLASTP results.
Guide to the Human Genome
Copyright © 2010 by Stewart Scherer. All rights reserved.
